
Weather
Land/Sea Temps & Clouds – UW-SSEC
See also:
- Satellite Imagery
- Current Conditions (Daily forecast, drought outlook, weather warning, max. temps. UV Index …)
Daily Maps of the Earth

Carbon Monoxide | OZONE | Day Air Temperature | Full Menu AIRS |
Real-Time U.S. Composite Satellite Image
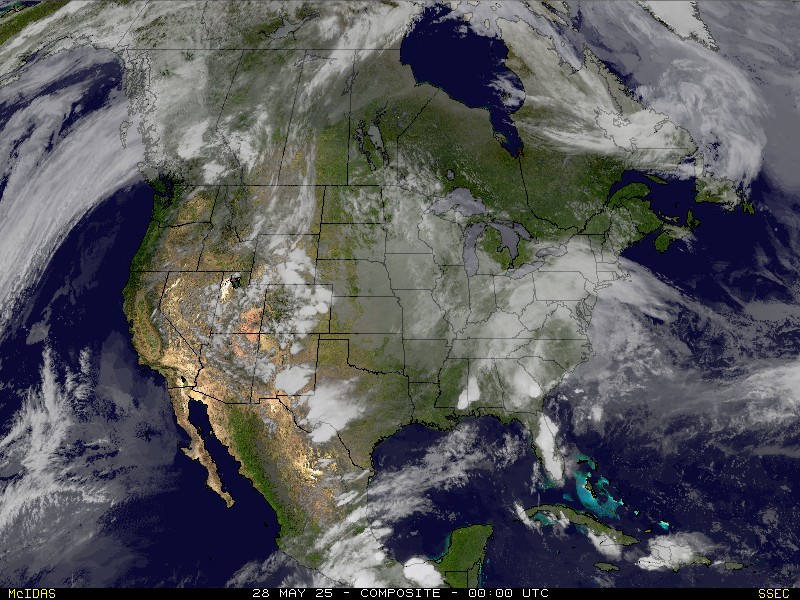
Click Image to enlarge. (24-Hr FE ED). Click HERE to Animate Image. (Source: SSEC/Wisc-Uni)
TRMM Rain Accumulation
- 24 HR Rain Values
- 72 HR Rain Values
- 168 HR Rain 168 HR Values

Average Rainfall Last 30 Days.

Rainfall Anomalies Last 30 Days.

Global Sea Surface Temperatures. UW- SSEC
Other Sea Surface Temperature Resources
- NOAA Comprehensive Large Array-data Stewardship System (CLASS) data archive
- NOAA NCDC Sea Surface Temperature Datasets
- NOAA Optimum Interpolation Sea Surface Temperature Analysis
- Sea Surface Temperature (SST) Contour Charts
Current SST Anomalies.
Sea Surface Temperature Anomaly Image Animation over the past six months (45N-45S)
Current NWS Weather Hazard Warnings (U.S.)
- Tornado
- Hurricane
- Severe Thunderstorm
- Flash Flood
- Flood
- Winter Storm
- Special Marine
- Non Precipitation
- Tsunami
- Space Weather
- All Warnings

Weather Map – Click Image to Enlarge –
- Loop of sea-level pressures and fronts through day 7
- Short range forecasts in jpeg format
- Short range HPC 500-mb Pattern Graphics

Current Climate Summary Maps
- Average Temperature

Temperature – Last 7 Days
- Temperature Departure from Normal

- Precipitation

Total Precipitation

NWS RADAR Mosaic

NWS Radar Mosaic. Click Image to enlarge and update. (24-Hr FE ED).

Hazards. Click Image to enlarge and update. (24-Hr FE ED).

Snow Accumulation. Click Image to enlarge and update. (24-Hr FE ED).

Weather Forecast. Click Image to enlarge and update. (24-Hr FE ED).
Near-Real-Time Thermal Monitoring of Global Hot-spots

Predominant Weather. Click Image to enlarge and update. (24-Hr FE ED).

IR Satellite Image. Click Image to enlarge and update. (24-Hr FE ED).

Water Vapor Satellite Image. Click Image to enlarge and update. (24-Hr FE ED).

Max Temps. Click Image to enlarge and update. (24-Hr FE ED).

Min Temps. Click Image to enlarge and update. (24-Hr FE ED).

Temp – Real Time Mesoscale Analysis. Click Image to enlarge and update. (24-Hr FE ED).

6-Hr Precipitation amount. (24-Hr FE ED). Click Image to enlarge and update.

12-Hr Probability Precipitation (%). Click Image to enlarge and update. (24-Hr FE ED).

Wind Speed. Click Image to enlarge and update. (24hr- FE ED).

Wind Gusts. Click Image to enlarge and update. (24hr- FE ED)

Sky Cover. Click Image to enlarge and update. (24hr- FE ED)
River and Lake Levels
US Seasonal Drought Outlook. Click Image to enlarge.

Surface Weather Charts. Click image to enter portal.
GOES East Hurricane Tracking Sector
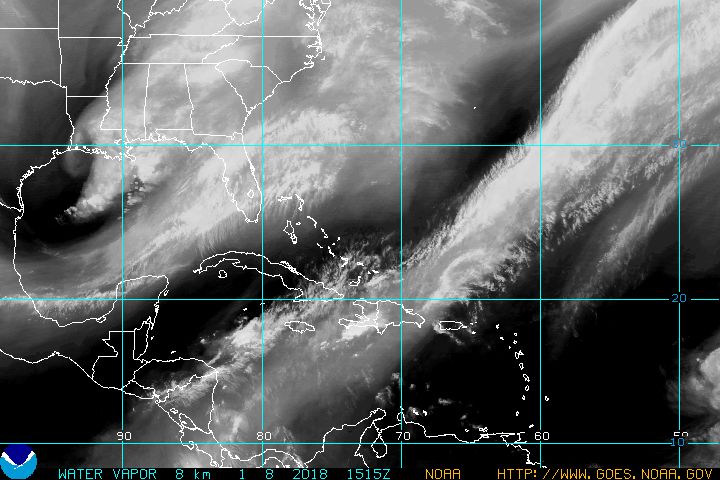
NOAA: GOES East Hurricane Tracking Sector (Water Vapor Channel) – Updated every 30 minutes.
Current Heavy Rain, Flood and Landslide Estimates

Areas with Severe Flood Potential


Click on the maps for regional displays with more information


GOES East – Eastern U.S. Imagery

An aviation color enhancement of a satellite image. GEOS Eastern U.S. Imagery, NOAA SSD.
GOES West – West U.S. Coast Imagery
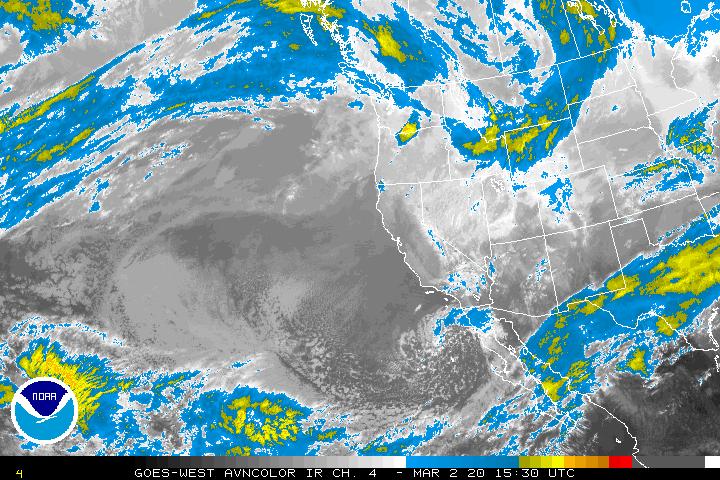
An aviation color enhancement of a satellite image. GEOS West West U.S. Coast Imagery, NOAA SSD.
Other Images
[To view full size image, right-click on the target image and choose View Image ]

MTSAT Tropical Imagery: West Pacific – Wide View
MTSAT Tropical Imagery: East & Central Pacific – Wide View

GOES Northeast Pacific Imagery
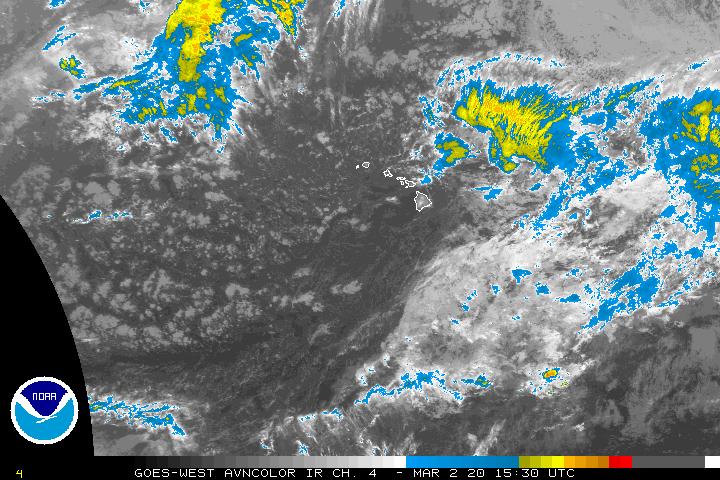
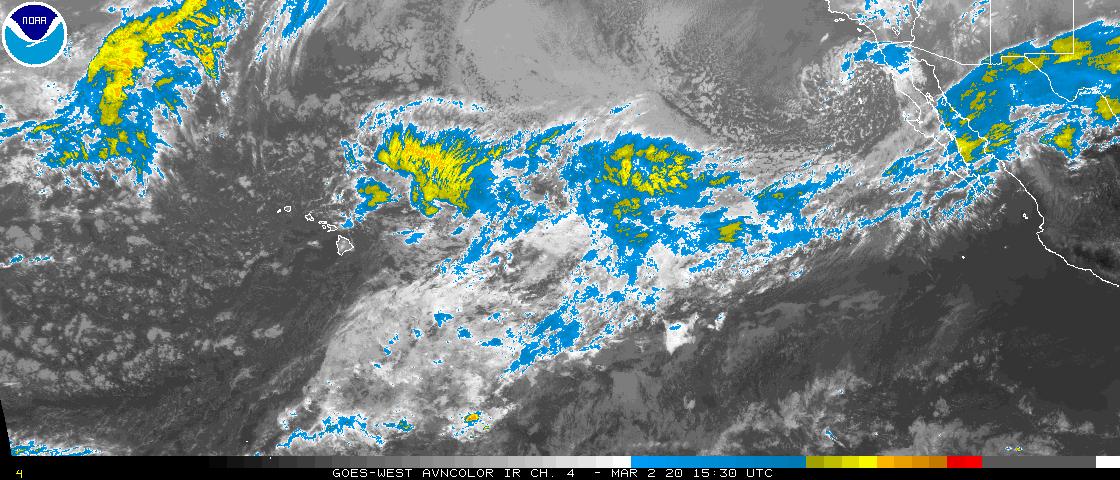
GOES West – Central Pacific Imagery

MTSAT Northwest Pacific Imagery

GOES Eastern East Pacific Imagery
GOES East Full Disk Pictures
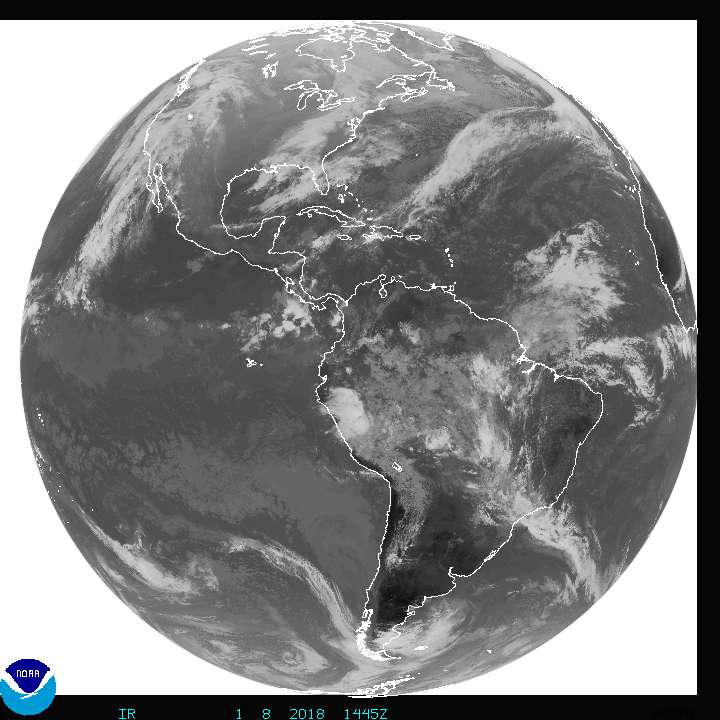
GOES East Full Disk – images are updated every three (3) hours.
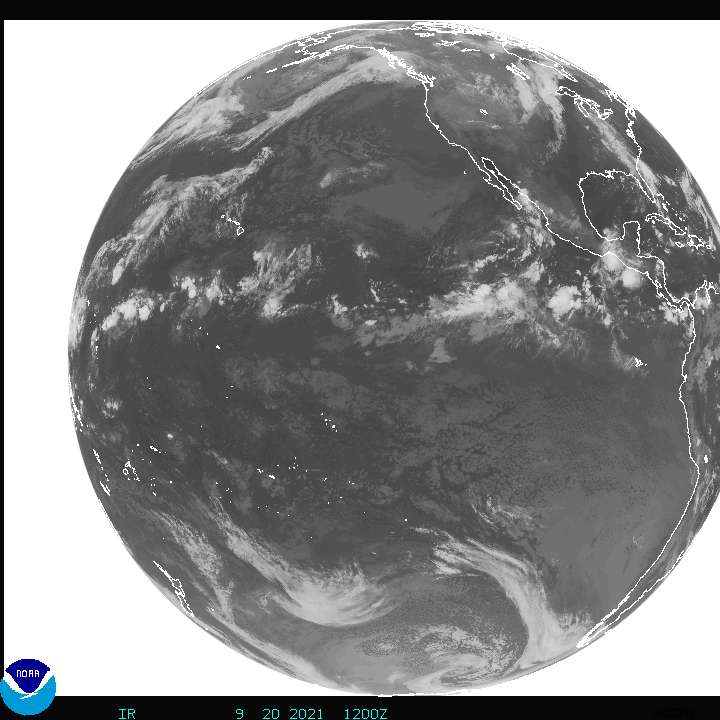
GOES West Full Disk – images are updated every three (3) hours.
From the Indian Ocean Date Coverage (IODC) – Images are updated every six (6) hours
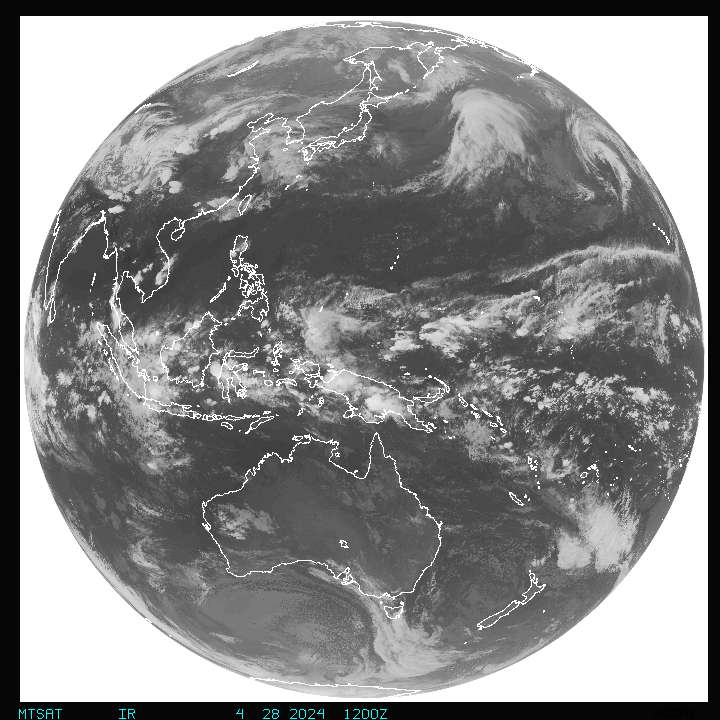
MTSAT – Fulldisk Global Images (Images are updated every hour)
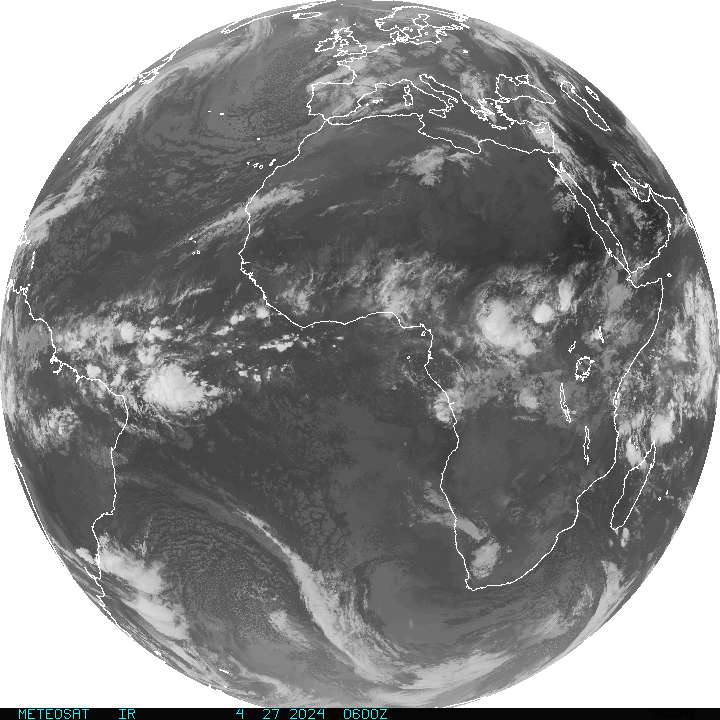
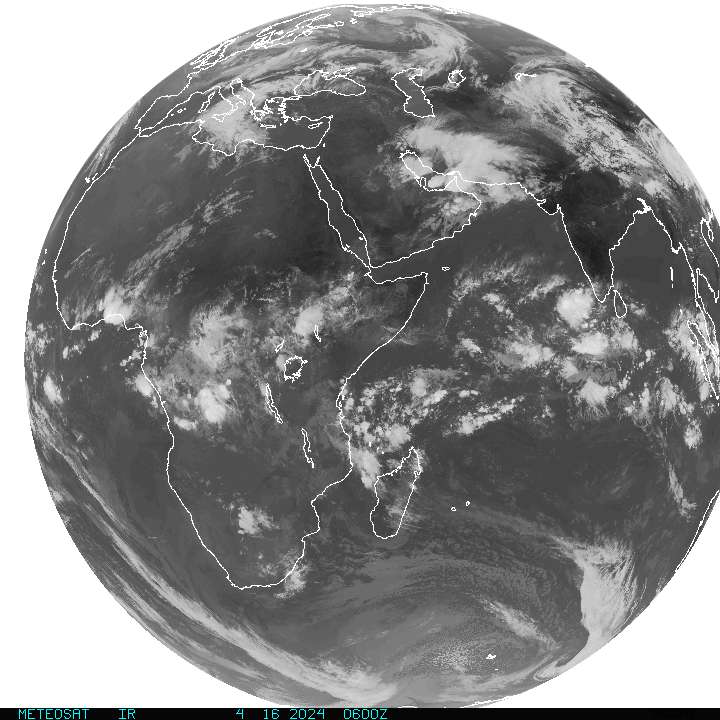
METEOSAT- Fulldisk Global Satellite Images (Images are updated every six (6) hours)
GOES Infrared

GOES North America Water Vapor

GOES Eastern US SECTOR Infrared Image
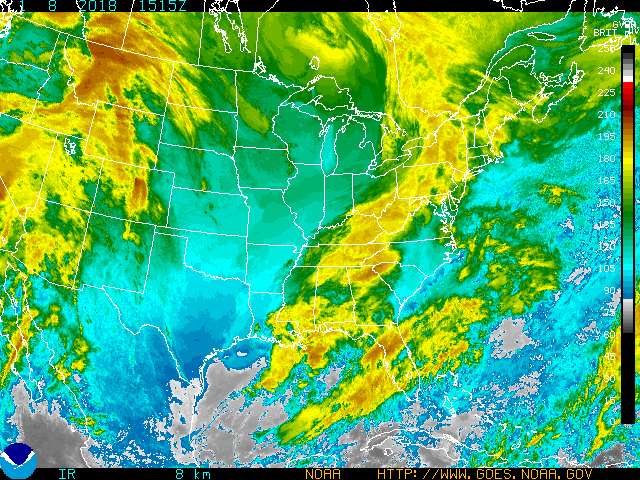
Eastern Conus Sector (Infrared Channel) – National Oceanic and Atmospheric Administration (NOAA)
[For IR data, the highest pixel values correspond to the coldest temperatures.]
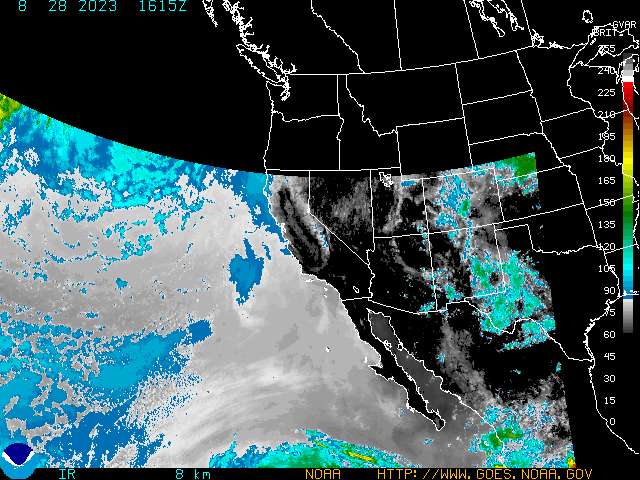
Western Conus Sector (Infrared Channel) – National Oceanic and Atmospheric Administration (NOAA)
[For IR data, the highest pixel values correspond to the coldest temperatures.]
National Weather Service

For warning codes see: National Oceanic and Atmospheric Administration’s National Weather Service
Other Links:
- Space Science and Engineering Center – University of Wisconsin, Madison
- OceanView
- NOAAWATCH
The National Operational Hydrologic Remote Sensing Center
Snow Cover Animations:
- Snow Water Equivalent: Season — Two weeks — One Day
- Snow Depth: Season — Two weeks — One Day
- Average Snowpack Temp: Season — Two weeks — One Day
- SWE Change: Season — Two weeks — One Day
- Snow Precipitation: Season — Two weeks — One Day
- Snow Melt: Season — Two weeks — One Day
- Blowing Snow Sublimation: Season — Two weeks — One Day
- Surface Sublimation: Season — Two weeks — One Day
- Non-Snow Precipitation: Season — Two weeks — One Day
Click Below for 31 Day Animations
World Now
EO Global Maps:
Current Conditions (US):
- Weather Warnings
- Doppler Radar
- River and Lake Levels
- Drought Outlook
- Surface Weather Charts
- Daily Forecast Map Archive
- La Niña / El Niño Index
- Today’s UV Index Forecast Map
- Daily Maximum Heat Index Maps
- Severe Weather Information Center
- Wildfires [GOES-11 and 12 Wildfire ABBA Products]
- Weather NOW
- National Hurricane Center
- Coast Watch
- Current Heavy Rain, Flood and Landslide Estimates (TRMM)
Satellite Imagery
- Central Pacific Hurricane Center
- Joint Typhoon Warning Center
- Canadian Hurricane Centre
- WMO Severe Weather Info Centr
Links to more satellite data:
- NOAA National Hurricane Center – for official forecasts and outlooks.
- University of Wisconsin SSEC GOES Images and Loops
- QuickScat Scatterometer Winds
- RAMSDIS Online – Tropical
- Navy Research Laboratory – Tropical Satellite Products
- NASA Global Hydrology and Climate Center
- The Geostationary Satellite Server – Tropical Page
- NOAA/NESDIS Center for Satellite Applications and Research FPDT
Alternate Real-Time Tropical Cyclone Sites (NHC)
- Atlantic Tropical Weather Center
- BBSR Bermuda Weather Page
- Canadian Hurricane Center
- Central Pacific Hurricane Center
- EMWIN Houston
- FEMA Tropical Storm Watch
- Florida EXPLORES! Hurricanes
- Hurricane Climate
- Hurricane Watch Net
- Joint Typhoon Warning Center, Hawaii
- Mid-Atlantic Weather Station – Hurricane & Tropics Page
- Naval Atlantic Meteorology and Oceanography Center, Norfolk VA
- Naval Pacific Oceanography and Meteorology Center, Hawaii
- Naval Research Laboratory Tropical Cyclone Page
- Ohio State University Tropical Page
- Scripps Institute Tropical Storm Tracks
- Stormcentral
- Tropical Weather: Hurricanes, Tropical Storms, and Typhoons
- University of Hawaii Tropical Storms (Worldwide)
- University of Hawaii Tropical Storm Tracks
- University of Wisconsin CIMSS Tropical Cyclones
- US Army Corps of Engineers – Hurricane Response
- Weather.gov – Tropical Products (text format)
- WeatherMatrix Tropical Page
- Weather Underground of Hong Kong Tropical Cyclones
- World Meteorological Organization Severe Weather Information Centre
Links to Other Real Time Data Sites (NHC/NWS)
- Colorado St. University Tropical Weather Data
- Florida St. University Weather Data
- Hurricane Hollow Weather
- Hurricane Project
- Internet Partnership Radio
- Live Weather Images
- MESO Tropical Atlantic Headquarters
- NDBC Interactive Marine Obs
- Ohio St. University Atmospheric Sciences
- RSMAS Environmental Observations, University of Miami, Florida
- San Francisco St. University California Regional Weather
- SRCC Current Weather
- Ten Spider Weather & Meteorology
- Texas A&M Weather Center
- University of Hawaii Weather Server
- University of Illinois Weather Data
- University of Wyoming Weather Page
- Weather Information Network
- Weatherman 911

Kelly M said
Historic storm drops 60 inches of snow on Erie
The record-setting snow has made December 2017 the snowiest month in Erie, by more than 30 inches, on National Weather Service records dating back to the late 1800s.
Erie County Exec. signed a declaration of disaster emergency early Tuesday afternoon. The declaration will allow officials to bring in some National Guard resources.
Erie and Millcreek Township both declared snow emergencies on Tuesday morning because of dangerous and unpassable roads.
http://www.goerie.com/news/20171227/historic-storm-drops-60-inches-of-snow-on-erie
JJP said
2016 ties with 2007 for second lowest Arctic sea ice minimum
Arctic sea ice appears to have reached its seasonal minimum extent for 2016 on September 10. A relatively rapid loss of sea ice in the first ten days of September has pushed the ice extent to a statistical tie with 2007 for the second lowest in the satellite record. September’s low extent followed a summer characterized by conditions generally unfavorable for sea ice loss.
On September 10, Arctic sea ice extent stood at 4.14 million square kilometers (1.60 million square miles). This appears to have been the lowest extent of the year and is tied with 2007 as the second lowest extent on record. This year’s minimum extent is 750,000 square kilometers (290,000 square miles) above the record low set in 2012 and is well below the two standard deviation range for the 37-year satellite record.
Weather in early September was warm along the Siberian coast (up to 9 degrees Celsius or 16 degrees Fahrenheit above average), with high pressure over the same region and strong winds across the central Arctic. However, as discussed in previous posts, weather over the Arctic Ocean this past summer has been generally stormy, cool, and cloudy—conditions that previous studies have shown to generally limit the rate of summer ice loss. That September ice extent nevertheless fell to second lowest in the satellite record is hence surprising. Averaged for July through August, air temperatures at the 925 hPa level (about 2,500 feet above sea level) were 0.5 to 2 degrees Celsius (1 to 4 degrees Fahrenheit) below the 1981 to 2010 long-term average over much of the central Arctic Ocean, and near average to slightly higher than average near the North American and easternmost Siberian coasts. Reflecting the stormy conditions, sea level pressures were much lower than average in the central Arctic during these months.https://nsidc.org/
April had 195 reported tornadoes « Fire Earth said
[…] Weather […]
Saturn-like Storms Strike Southeast U.S. « Fire Earth said
[…] Weather […]
Deadly Storm Strikes Northeastern U.S. « Fire Earth said
[…] Weather […]
The Alps buried under 6 feet of snow « Fire Earth said
[…] Weather […]
The Storms Attack on California « Fire Earth said
[…] Weather […]
California: Powerful new storm sails ashore « Fire Earth said
[…] Weather […]
Hurricane Norbert Now a Cat 2 off Pacific Mexico « Fire Earth said
[…] Weather […]
Fay drops 25 inches of rain on Melbourne « Fire Earth said
[…] Weather […]
Fay May Strengthen to Hurricane Force « Fire Earth said
[…] Weather […]
Tropical Storm EDOUARD forms in the Gulf of Mexico « Fire Earth said
[…] Weather […]
UPDATE: California Fires « Fire Earth said
[…] Weather […]
UPDATE: HURRICANE BERTHA « Fire Earth said
[…] Weather […]