
Polar Ice Caps
Arctic Sea Ice; Antarctic Ice Shelves; Related News, Analysis and Links
Daily image update


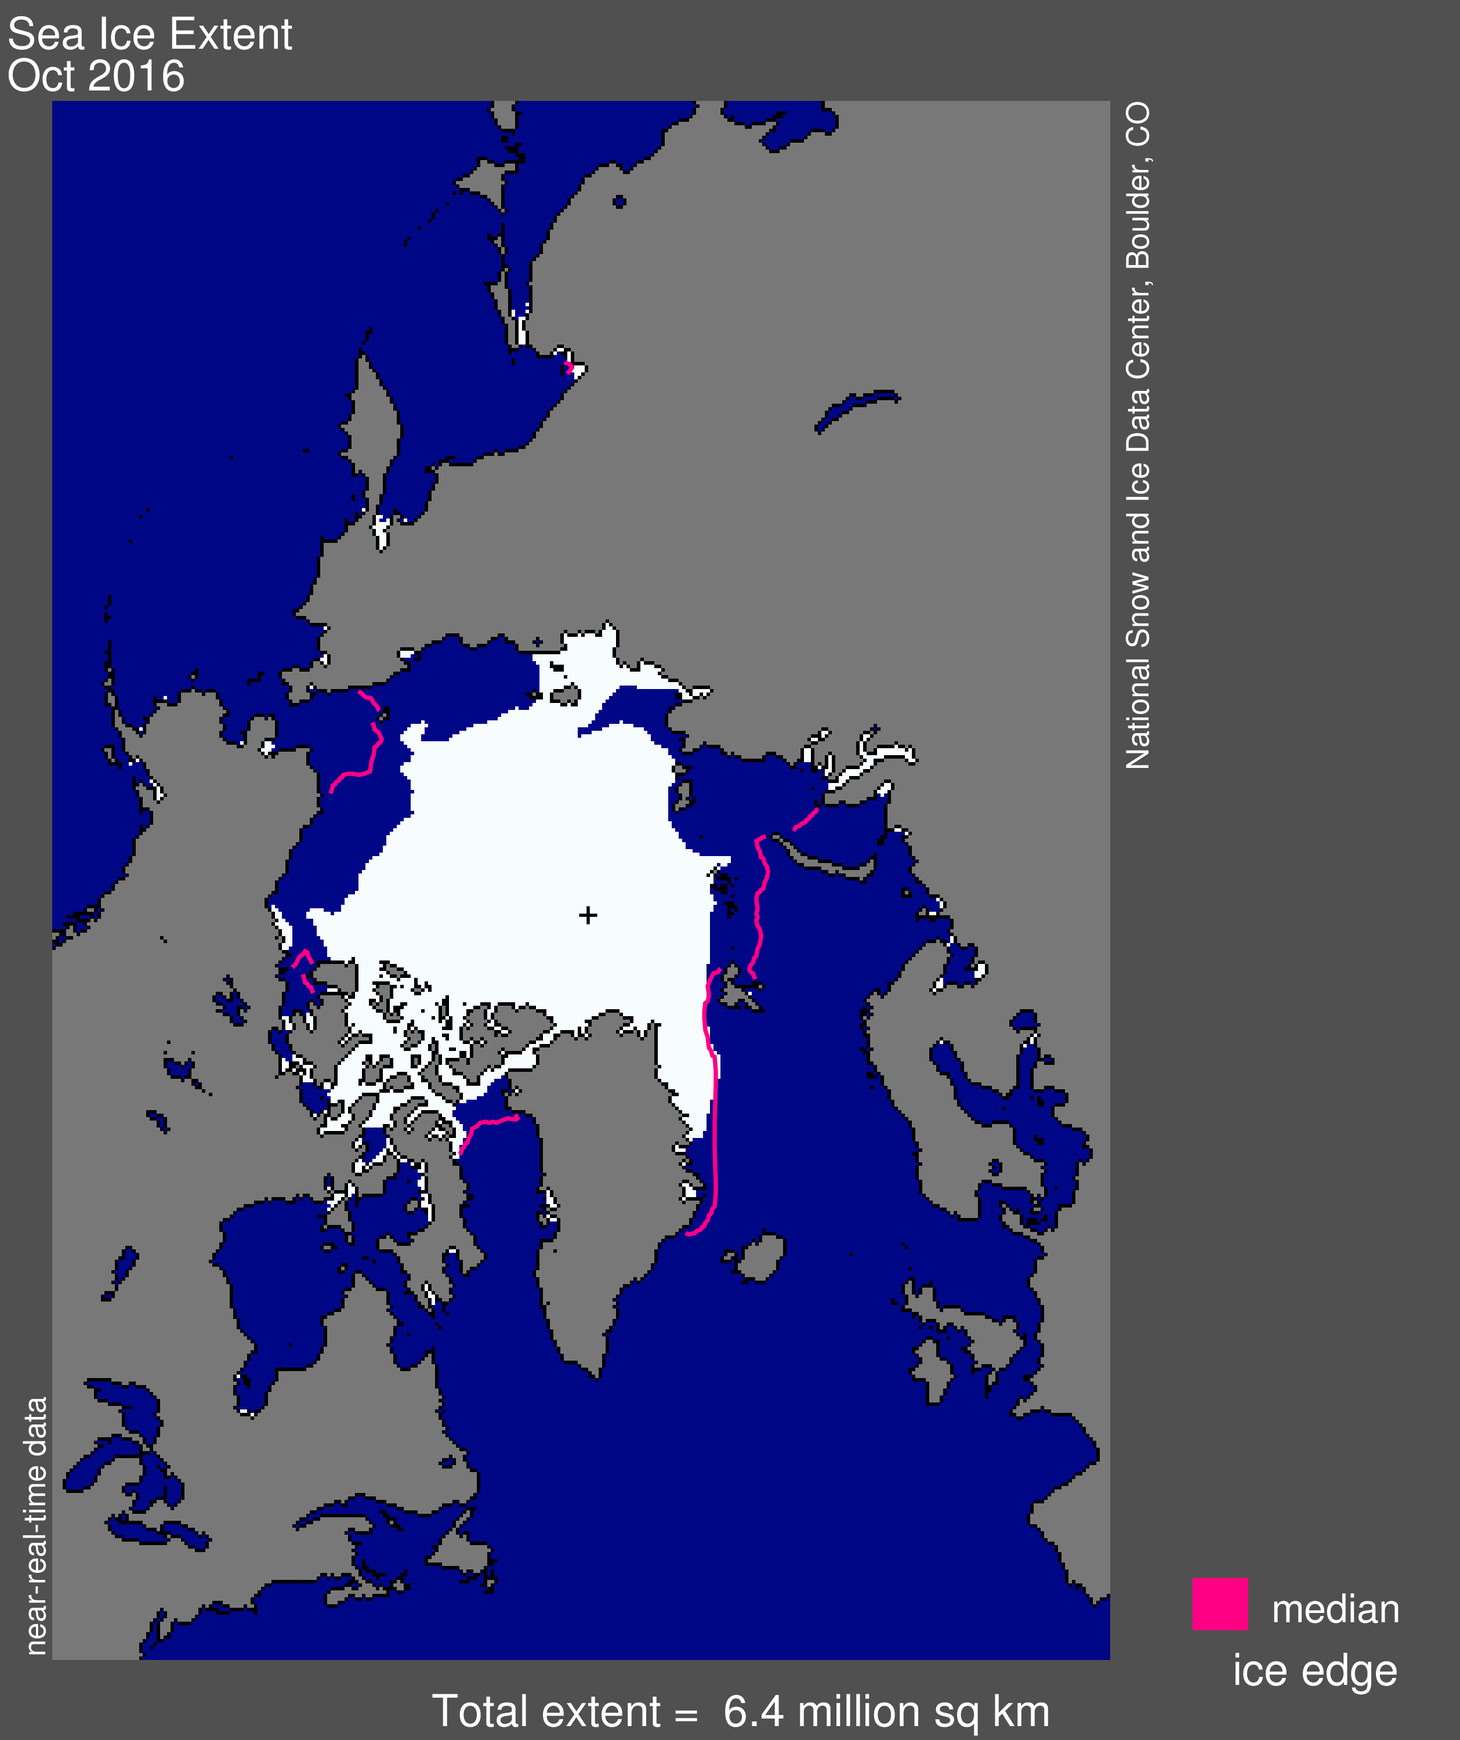
Sea ice data updated daily, with one-day lag. Orange line in extent image (left) and gray line in time series (right) indicate 1979 to 2000 average extent for the day shown. Click for high-resolution image. Learn about update delays, which occasionally occur in near-real-time data. Read about the data. Credit: National Snow and Ice Data Center
OceanView
Sea Surface Temperatures

GOES Floater Imagery – 30 minute updates
Atlantic Views GOES-East
Atlantic Wide View Infrared Image

Western Atlantic IR (color enhanced) Image

GOES-West
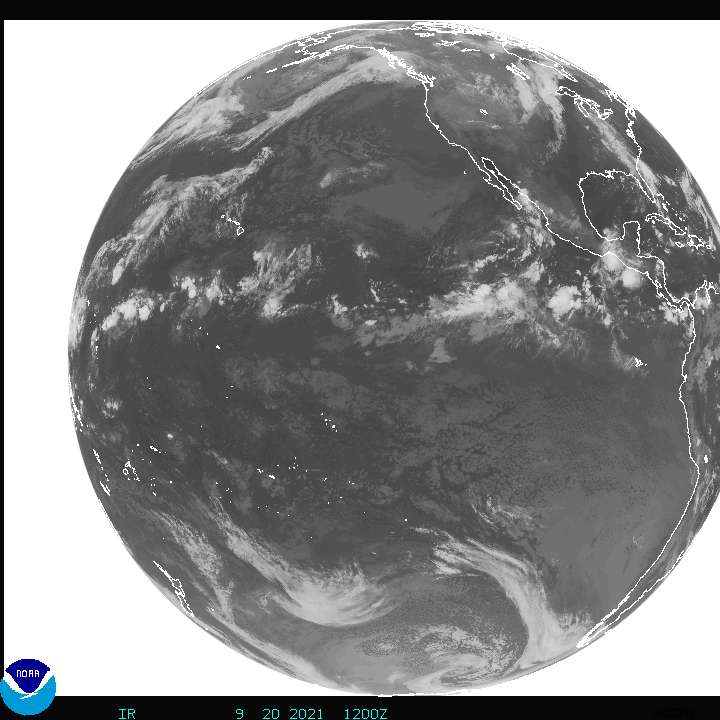
Pacific Wide View Infrared Image

North East Pacific IR (color enhanced) Image

Above Images: NOAA National Hurricane Center
GOES satellite images: GOES 12 infrared image

Atlantic Tropical Cyclone Activity

See also Weather for more images.
GOES East – Eastern U.S. Imagery

An aviation color enhancement of a satellite image. GEOS Eastern U.S. Imagery, NOAA SSD.
[Updated every 30 minutes.]
GOES West – West U.S. Coast Imagery
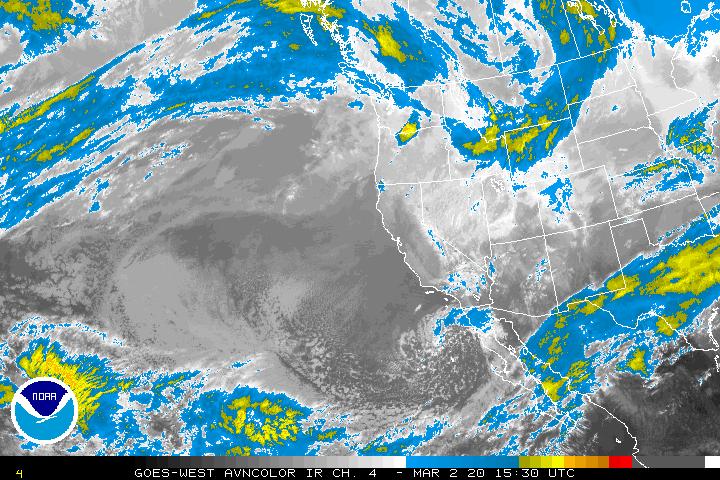
An aviation color enhancement of a satellite image. GEOS West West U.S. Coast Imagery, NOAA SSD.
[Updated every 30 – 60 minutes.]
Other Images
[To view full size image, right-click on the target image and choose View Image ]

MTSAT Tropical Imagery: West Pacific – Wide View
MTSAT Tropical Imagery: East & Central Pacific – Wide View

GOES Northeast Pacific Imagery
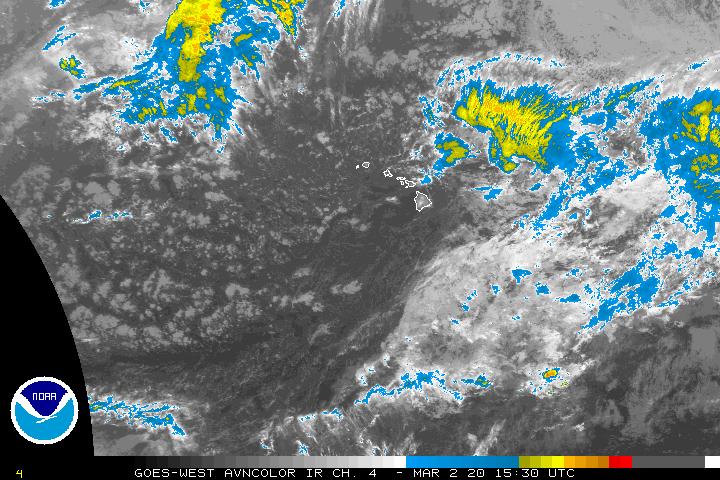
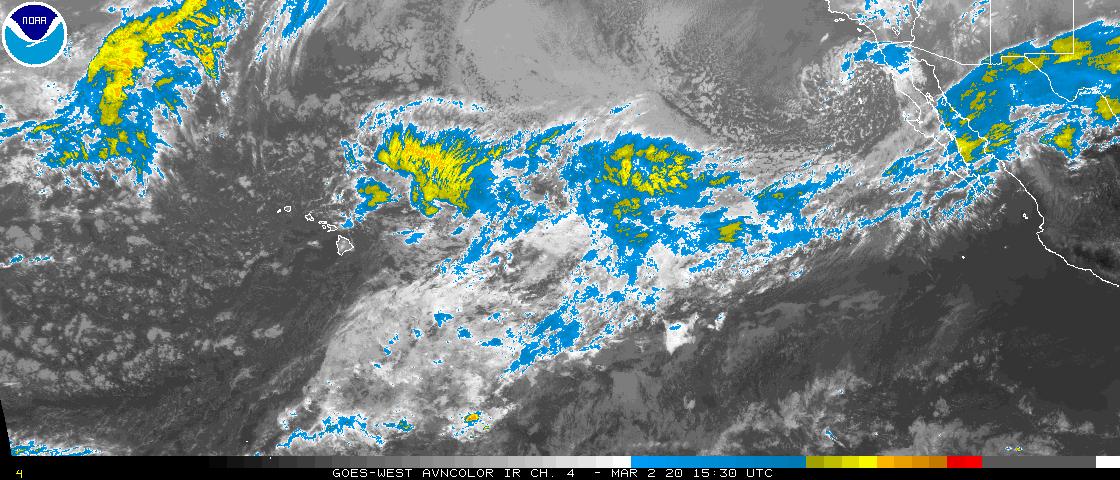
GOES West – Central Pacific Imagery

MTSAT Northwest Pacific Imagery

GOES Eastern East Pacific Imagery
GOES East Full Disk Pictures
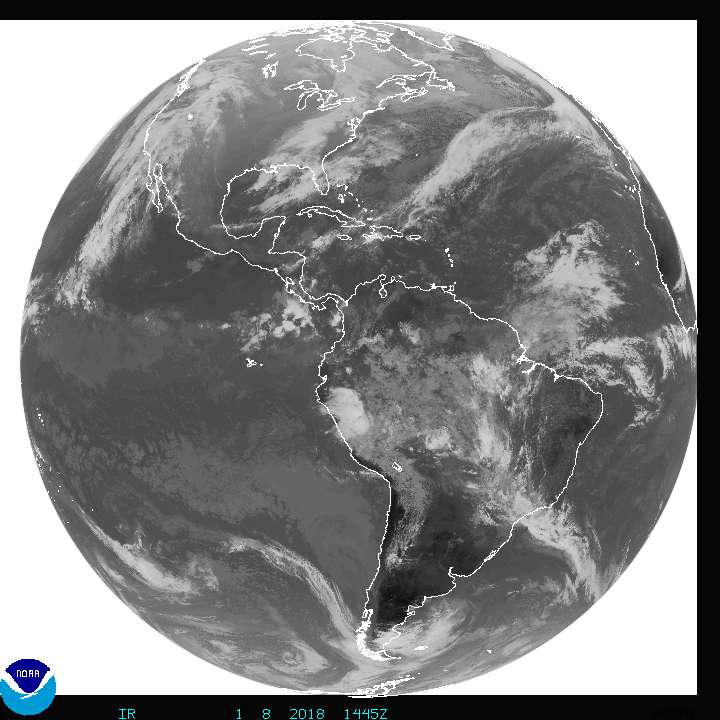
GOES East Full Disk – images are updated every three (3) hours.
GOES West Full Disk – images are updated every three (3) hours.
From the Indian Ocean Date Coverage (IODC) – Images are updated every six (6) hours
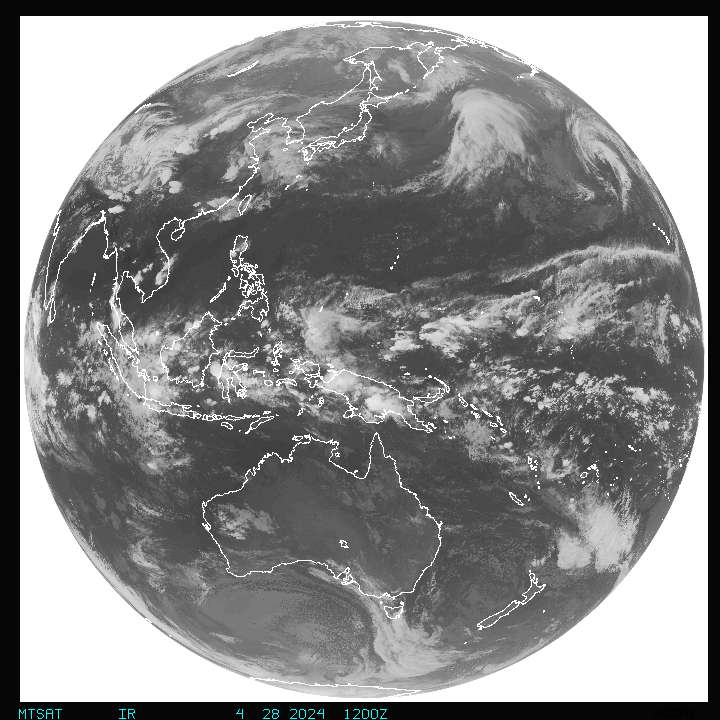
MTSAT – Fulldisk Global Images (Images are updated every hour)
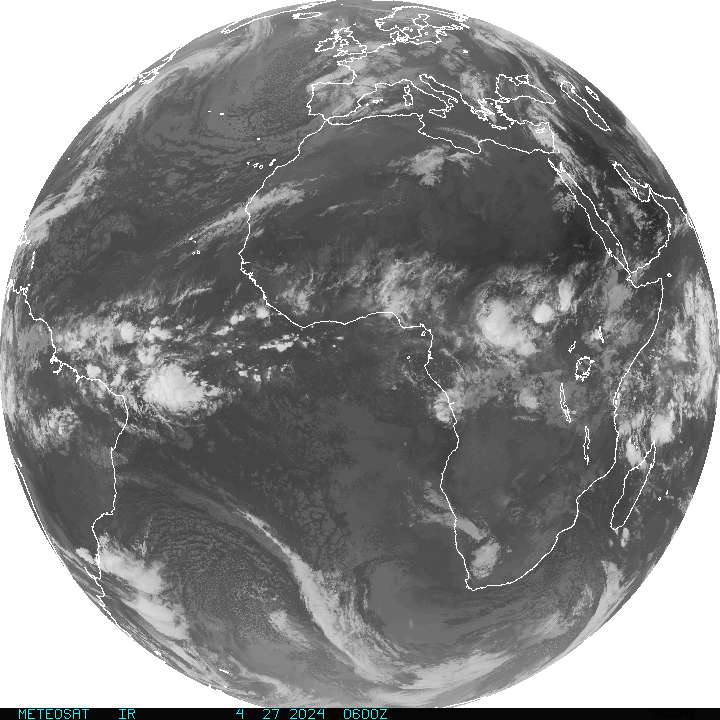
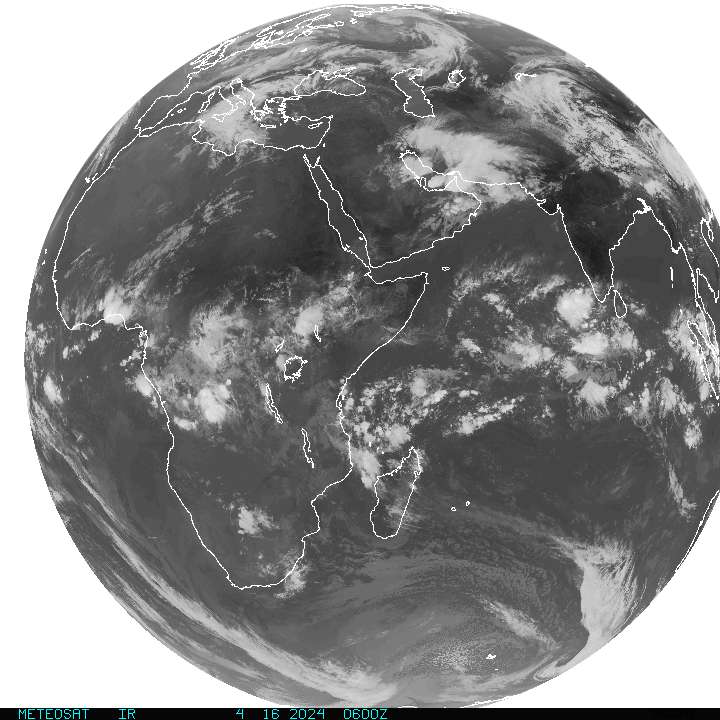
METEOSAT- Fulldisk Global Satellite Images (Images are updated every six (6) hours)
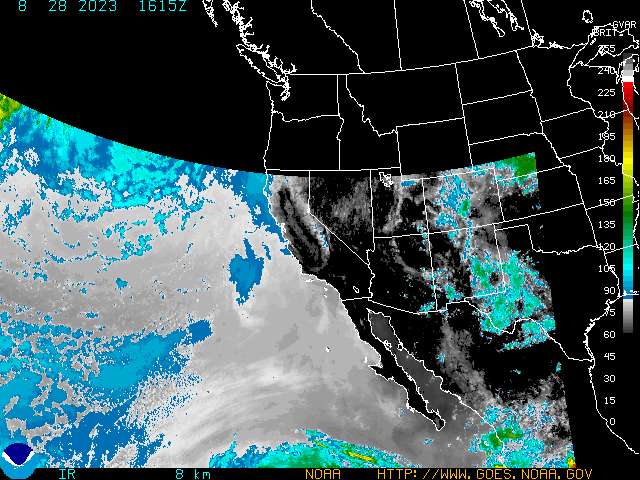
Western Conus Sector (Infrared Channel) – National Oceanic and Atmospheric Administration (NOAA)
[For IR data, the highest pixel values correspond to the coldest temperatures.]
Related Links:
- Anthropogenic Hell Melting Icebox Posted on September 13, 2012
- Image of the Day: ASIE Posted on September 7, 2012
- Arctic Sea Ice Extent Could Fall to 3M Km² Posted on September 3, 2012
- Arctic Sea Ice Extent Down to 3.87M km² and Melting Posted on August 31, 2012
- Arctic Sea Ice Extent Breaks Record Low and Melting Posted on August 28, 2012
- Arctic Sea Ice Extent Rapidly Decreasing Posted on August 21, 2012
- Arctic sea ice may fall to record lows Posted on September 7, 2011
- 2011 warmest year with La Niña event Posted on November 30, 2011
- The Balding Arctic Sea Posted on October 6, 2010
- Arctic Ice Affects Global Climate, Weather Posted on March 17, 2010
- 133,000,000 Wise Monkeys Posted on March 16, 2010
- December Ocean Temperature 2nd Warmest Posted on January 23, 2010
- Ice of the Past Posted on January 17, 2010
- Decadal Temp Avg Up by 74 pct on 1990s Posted on December 9, 2009
- Polar Ice Caps Posted on September 18, 2009
- Arctic ice cover third-smallest area on record Posted on September 18, 2009
- Arctic Warmest in 2000 Years Posted on September 3, 2009
- Another Ocean Record Broken Posted on August 19, 2009
- Arctic Tundra 4ºC Hotter Since 1970 Posted on July 30, 2009
- Eco-Terrorists on Thin Ice Posted on April 7, 2009
- Guess what, the Arctic temps are 5 ºC warmer! Posted on October 17, 2008
- A Haiku for Earth Posted on September 10, 2008
- Arctic ice cover second-lowest on record Posted on August 28, 2008
- Arctic sea ice has thinned dramatically Posted on July 8, 2009
- Arctic Sea Ice: Likely Record-Low Volume Posted on October 4, 2008
- Critically Endangered Species: Arctic Sea Ice Posted on September 10, 2008
- Drunken Forest Posted on June 11, 2008
- Tipping Point: Here and Now! Posted on April 30, 2008
- Selected Headlines Posted on April 7, 2008
- Climate Change: For what you’re about to receive…
- Arctic Warmest in 2000 Years
- Another Ocean Record Broken
- US glaciers shrinking dramatically
- Alaska: One Fire Away From Exporting Charcoal
- Alaska on Fire
- Arctic Tundra 4ºC Hotter Since 1970
- US Gov Releases Intelligence Images of Arctic Ice
- Strong Quake Strikes Baffin Bay
- Airlines
- The Deadly Dozen, the Dirty Dozen, the Dozen Dozen
- Eco-Terrorists on Thin Ice
- Emerging Patterns of Vanishing Ice Shelves
- STOP Killing Our Oceans!
- Possible Thule Eruption Disastrous for Antarctic Ice
- Alp-sized mountain range encased in Antarctic ice
- Climate Change Finals – CO2: 392 Human Chances: 0
- Image of the Day: Antarctica
- Warmer temperatures destroy forests faster
- If You Thought Antarctica, Too, Must Be Warming
- Earth’s Climate: A Solar Powered System
- WILKINS ICE SHELF IS “HANGING BY A THREAD”
- Ice Melt in Alaska, Antarctica, Greenland Accelerating
- Guess what, the Arctic temps are 5 ºC warmer!
- Antarctic Ozone Depth Down to 100 DU
- Arctic Sea Ice: Likely Record-Low Volume
- Does your mother shoot moose, too?
- Critically Endangered Species: Arctic Sea Ice
- A Haiku for Earth
- Canada’s Ice Shelves Lose Quarter of their Cover
- Palin’s Polar Pests Love Their Cubs, Too!
- Arctic ice cover second-lowest on record
- 3 million acres of spruce killed in Alaska in 15 years
- World CO2 Emissions
- Hilarious Polar Bear News!
- Oh, PLEEZE!
- This’s Got to Be the Year of Radioactive, Chemical and Oil Spills, Too!
- WhaleWatch
- Sea Surface Height Variations
- Is 350 ppm Safe? Hell, NO!
- A Few Extreme Events Away
- Drunken Forest
- Don’t Worry, it’s Only Earth
- Penguins DDT Contamination Levels Still High
- Tipping Point: Here and Now!
- Arctic Marine Mammals on Thin Ice
- Arctic Melting FAST!
- Freshening of deep Antarctic water could prove catasterophic
- Bering Sea Drilling
- A Fast-Warming World

PLBR said
https://nsidc.org/arcticseaicenews/
In October 2016, Arctic sea ice extent averaged 6.40 million square kilometers (2.5 million square miles), the lowest October in the satellite record. This is 400,000 square kilometers (154,400 square miles) lower than October 2007, the second lowest October extent, and 690,000 square kilometers (266,400 square miles) lower than October 2012, the third lowest. The average extent was 2.55 million square kilometers (980,000 square miles) below the October 1981 to 2010 long-term average.
As of early November, extent remains especially low within the Beaufort, Chukchi, East Siberian, and Kara Seas. Since the beginning of October, ice growth occurred primarily in the Laptev Sea, stretching from the New Siberian Islands towards the coast. Little ice growth occurred in the Kara and Barents Seas, while ice extent increased in the Chukchi and Beaufort Seas.
How Much Faster Do Greenland Glaciers Slide in Summer? « Fire Earth said
[…] Polar Ice Caps […]
Greenland Ice Sheet Losing Ice Mass « Fire Earth said
[…] Polar Ice Caps […]
133,000,000 Wise Monkeys « Fire Earth said
[…] Polar Ice Caps […]
December Ocean Temperature 2nd Warmest « Fire Earth said
[…] Polar Ice Caps […]
Ice of the Past « Fire Earth said
[…] Polar Ice Caps […]
Arctic ice cover third-smallest area on record « Fire Earth said
[…] Arctic Ice […]