Oceans, Where Life Started, Are Dying – Part II
Posted by feww on March 16, 2008
WILD FACTS SERIES – Lethal Marine Pollution
Major Problems: Fertilizer Runoff; Tourism; Coastal Developments; Marine Transportation; and Ocean Warming due to climate change
Pollution Load
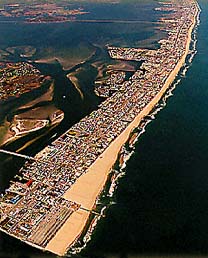
About 80% of the pollution load in the oceans originates from land-based activities directly affecting up to 80 percent of the world’s coastal areas and threatening the well-being of up to 4.5 billion people who live within a 60km radius of the coast, according to the UNEP (about 2billion people live in coastal urban centers).

Of the world’s 23 mega-cities (those with over 2.5 million inhabitants),
16 are in the coastal belt and are growing at a rate of about one million
people per day. ~ UN (Image credit: NOAA)
The sources of water pollution include
- Municipal and industrial wastes
- Agricultural runoff
- Atmospheric deposition

Creeping Dead Zone (Pub. Domain. Credit NASA)
Creeping Dead Zones
The hypoxic (low-oxygen) areas in the oceans are called dead zones. The 200 or so oxygen depleted regions in our oceans are normally caused by nutrients from runoff (chemical fertilizer, manure, sewage…). The increase in nutrients like nitrogen and phosphorous in the water is called eutrophication, a process that promotes excessive growth and decay of weedy plants and that is likely to cause severe reductions in water quality. When the decaying organic matter produced by aquatic vegetation or phytoplankton (an algal bloom) sinks to the bottom it undergoes breakdown by bacteria (bacterial respiration), a process which consumes the dissolved oxygen in the water and produces carbon dioxide. Respiration kills zooplankton, fish, crabs, clams, shrimp, and all other species that swim in the water or dwell on the muddy bottom of the lakes, rivers, estuaries and other water bodies. The water becomes cloudy and turns to a shade of red, yellow, green, or brown.
The size of aquatic and marine dead zones varies from about 1 to 70,000 square kilometers.

A dense bloom of poisonous cyanobacteria in the Potomac River estuary
(Credit:NOAA)
Gulf of Mexico
The largest dead zone in the US coastal waters measures about 25,000 square kilometer in the Gulf of Mexico caused by high-nutrient runoff dumped by the Mississippi River whose vast drainage basin covers the Midwest, the center of U.S. agribusiness. Another dead zone off the coast of Texas was discovered in July 2007.
According to a USGS study most of nutrients (75 percent of nitrogen and phosphorus) come from just nine states (total of 31 states share the basin) in the Mississippi River Basin: Arkansas, Illinois, Indiana, Iowa, Kentucky, Mississippi, Missouri, Ohio, Tennessee. Some 12 percent of the pollution originates from urban sources.
- Corn and soybean cultivation is responsible for the largest share of nitrogen runoff to the Gulf.
- Animal manure (see also New Zealand and Australia) on pasture and rangelands contribute a total of 37 percent to phosphors pollution.
- Crop cultivation is responsible for a total of 43 percent of phosphorus runoff.
Low oxygen levels in the waters of the Gulf Coast have affected the fish reproductive system causing “decreased size of reproductive organs, low egg counts and lack of spawning.” The nation’s largest and most productive fisheries are threatened as the result.
The Following excerpts are from Wikipedia: In a study of the Gulf killifish by the Southeastern Louisiana University done in three bays along the Gulf Coast, fish living in bays where the oxygen levels in the water dropped to 1 to 2 parts per million (ppm) for 3 or more hours per day were found to have smaller reproductive organs. The male gonads were 34% to 50% as large as males of similar size in bays where the oxygen levels were normal (6 to 8 ppm). Females were found to have ovaries that were half as large as those in normal oxygen levels. The number of eggs in females living in hypoxic waters were only one-seventh the number of eggs in fish living in normal oxygen levels. (Landry, et al., 2004)
Another study by the University of Texas at Austin Marine Science Institute was done on the Atlantic croaker fish in Pensacola Bay, Florida. The study was of year-old croakers that live in an estuary that has summer-long hypoxic conditions. During the study, none of the fish spawned at the expected time, or later. Examination of sample fish determined that they lacked mature eggs or sperm. (Murphy, et al., 2004)
Fish raised in laboratory created hypoxic conditions showed extremely low sex-hormone concentrations and increased elevation of activity in two genes triggered by the hypoxia-inductile factor (HIF) protein. Under hypoxic conditions, HIF pairs with another protein, ARNT. The two then bind to DNA in cells, activating genes in those cells.
Under normal oxygen conditions, ARNT combines with estrogen to activate genes. Hypoxic cells in a test tube didn’t react to estrogen placed in the tube. HIF appears to render ARNT unavailable to interact with estrogen, providing a mechanism by which hypoxic conditions alter reproduction in fish. (Johanning, et. al, 2004)
It might be expected that fish would flee this potential suffocation, but they are often quickly rendered unconscious and doomed. Slow moving bottom-dwelling creatures like clams, lobsters and oysters are unable to escape. All colonial animals are extinguished. The normal mineralization and recycling that occurs among benthic life-forms is stifled.
According to USGS Associate Director for Water, Dr. Robert Hirsch, the number of water quality monitoring stations along the Mississippi River Basin region has been decimated from 425 stations 15 years ago to just 32.

A combined sewer overflow runoff entering Fall Creek in Indianapolis, Indiana
(photo credit: Charles Crawford; courtesy USGS).
Agrofuel [biofuel] Crop Impact in The Gulf of Mexico
According to a computer model designed by researchers at the University of Wisconsin-Madison and the University of British Columbia, the exponentially increasing amounts of fertilizer needed to meet US production goals for biofuel production, especially the corn-ethanol, would increase the nitrogen loading from the Mississippi River into the Gulf of Mexico by up to 19 percent, increasing the size of dead zones.
The Mississippi River is about 2,300 miles (3,705 kilometers) long, according to the US Geologic survey. The River Basin or Watershed drains 41% of land in United States, an area of about 1.8 million square miles. Thirty-one states and two Canadian provinces are included in the watershed. The Mississippi carries an average of 500,000 tons of sediment each day.
The US Pacific Coast
Dead zone in the US Pacific coast covers an area of about 3,000 square kilometers. Worsened by strong winds caused by climate change, the Pacific dead zone has reoccurred every summer since 2002. See Photos of research during hypoxic events off the Oregon Coast
ROW
Other countries and regions where other dead zones have been reported since the 1970s include
- Chesapeake Bay (US)
- strait called the Kattegat strait (Scandinavia)
- The Baltic Sea (in multiple fishing grounds)
- Northern Adriatic
- And coastal waters of
- South America
- China
- Japan
- Throughout Southeast Australia
- New Zealand (Both Australia and NZ are major sources of industrial agriculture as well as sheep and cattle factory farming)

A map of the world’s dead zones created by Dr. Robert Diaz of the Virginia Institute of Marine Science (VIMS). Diaz estimates that the number of dead zones will double within a decade. Source: NASA
Coming Soon:
Oil Pollution
References:
- Landry, C.A., S. Manning, and A.O. Cheek. 2004. Hypoxia suppresses reproduction in Gulf killifish, Fundulus grandis. e.hormone 2004 conference. Oct. 27-30. New Orleans.
- Murphy, C. . . . P. Thomas, et al. 2004. Modeling the effects of multiple anthropogenic and environmental stressors on Atlantic croaker populations using nested simulation models and laboratory data. Fourth SETAC World Congress, 25th Annual Meeting in North America. Nov. 14-18. Portland, Ore.
- Johanning, K., et al. 2004. Assessment of molecular interaction between low oxygen and estrogen in fish cell culture. Fourth SETAC World Congress, 25th Annual Meeting in North America. Nov. 14-18. Portland, Ore.
- Nutrients in the Nation’s Waters–Too Much of a Good Thing? U.S. Geological Survey Circular 1136.
- Pisco
- Living on Earth
- PLASTIC POLLUTION IN THE MARINE ENVIRONMENT:BOATERS CAN HELP CONTROL A GROWING PROBLEM
- Plastic in the Sea
- Trashed: Across the Pacific Ocean, Plastics, Plastics, Everywhere
- The Deadliest Predator in the Sea
- Plastic Oceans: unimaginable pollution
- Plastic pollution in our oceans (slideshow)
- Oceans
- Pollution of the Ocean by Plastic and Trash
- Pacific’s plastic pollution threatens our food chain
- Plastic Pellets in the Aquatic Environment: Sources and Recommendations
- A Primeval Tide of Toxins
- Social Responses (PDF)
- UN Atlas of Oceans
- Dead Zones
- North Pacific Gyre (Links to videos)
See Also: Our Dying Oceans (Parts I, II,III, and IV)
FEWW Fair Use Notice!

New Zealand Lamb Week « Apartheid New Zealand said
[…] of New Zealand. Both NZ and Australia are major sources of industrial agriculture as well as sheep and cattle factory farming. “New Zealand cattle and sheep also produce methane emissions equivalent to 33 million tons of […]
To & From New Zealand: Double Act of Eco-Terrorism « Fire Earth said
[…] of New Zealand. Both NZ and Australia are major sources of industrial agriculture as well as sheep and cattle factory farming. “New Zealand cattle and sheep also produce methane emissions equivalent to 33 million tons […]
North Pacific Gyre « Fire Earth said
[…] Pacific Gyre … on Oceans, Where Life Started, Ar…neath on North Pacific GyreOceans, Where Life S… on North Pacific GyreCorn for Food, NOT f… on Riots across Egypt amid […]
Oceans, Where Life Started, Now Dying « EDRO said
[…] […]
Oceans, Where Life Started, Are Dying - Part I « Fire Earth said
[…] (RSS) « Hospital Food Infected with Listeria Oceans, Where Life Started, Are Dying – Part II […]