Fire Earth

Earth is fighting to stay alive. Mass dieoffs, triggered by anthropogenic assault and fallout of planetary defense systems offsetting the impact, could begin anytime!

Archive for the ‘dying oceans’ Category

10 million pieces of trash plucked from water in 1 day

Posted by feww on April 14, 2010

Flip-flops washed ashore near the Arctic Circle

“We saw flip-flops washing ashore on these islands in far northern Norway near the Arctic Circle,” said Cousteau, an environmentalist.

“People don’t wear flip-flops in the Arctic, at least not if they’re sane.”

Half a million volunteers around the world retrieved 10,239,538 pieces of trash from our ocean, lakes and waterways in a single day, September 19, 2009. The trash weighed about 3.4 million kg (7.4 million pounds), a tiny fraction of the total marine litter. Most of marine trash starts on land.

Clean This!
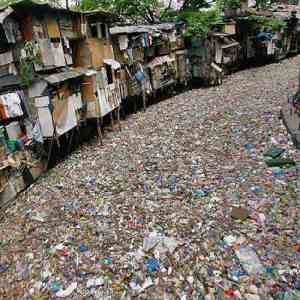

Citarum River, Indonesia.  More than 500 factories along the banks of the 330km long Citarum River, contribute to this man-made disaster. Source: Sea-way. Click image to enlarge.

Highlights from The 2009 International Coastal Cleanup

Volunteers around the world covered 14,827 miles, more than six times the length of the Mississippi river, and found:

  • 336 marine animals, including 138 birds, entangled in marine debris 120 of the animals were still alive and released. Fishing line and nets were some of the most dangerous items, trapping over 200 animals
  • 512,517 cups, plates, forks, knives and spoons enough to provide a full set of dinnerware to over 100,000 people
  • 8,881 bottles of oil/lube during the cleanup. This is the amount that would be used to change the oil in nearly 12,000 mid-sized cars
  • More than 40 percent of all trash was collected in the United States
  • About 20 percent of the garbage collected threatened public health, and most debris were a threat to marine animals.

Clean This!
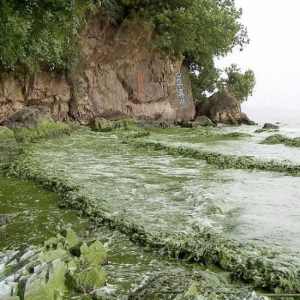

Lake Tai, the 3rd largest lake in China, is covered in green algae. About 3,000 factories located on the shores of Lake Tai have turned the lake into one of the most polluted in China. Click image to enlarge.

What If:
What if the same number of volunteers removed  the same amount of trash from the ocean every day, instead of just one day of the year?
It wouldn’t make the slightest bit of difference.

Why NOT?
For three reasons:

  • First, the amount of litter retrieved would still constitute only a tiny fraction of the overall trash in the world’s waterway.
  • Third, nearly all of the sewage, agricultural, industrial, chemical/toxic pollution that enter the waterways dissolve in the water and become invisible.

The Problem?

To stop the trash entering our oceans and waterways, you have to stop producing waste. There’s no other formula that works.

The source of our oceans’ grave illnesses are the system of exponential growth economy, that cannot thrive without generating mountains of harmful waste. You cannot stop the oceans from dying without first changing the economy from its current state, into an eco-centered Oikonomia.

How Effective is the Work Done by Ocean Conservancy?

Coca-Cola, the Dow Chemical and the likes that have embedded  Ocean Conservancy ares the Praetorian Guards of the predatory economic system. It’s difficult to see how those companies would seriously act against their own monetary interests.

Related Links:

Serial No 1,570. Starting April 2010, each entry on this blog has a unique serial number. If any of the numbers are missing, it may mean that the corresponding entry has been blocked by the authorities/Google in your country. Please drop us a line if you detect any anomaly/missing number(s).
Posted in dying oceans, marine trash, ocean pollution, Water pollution | Tagged: , , , , | 1 Comment »

Another Ocean Record Broken

Posted by feww on August 19, 2009

Congratulations! We’ve broken another ocean record!

Warmest Global Ocean Surface Temperatures on Record for July: NOAA

Our planet experienced the  warmest ocean surface temperature on record for July, exceeding the previous record established in 1998, NOAA’s National Climatic Data Center in Asheville, N.C., reported.

As for the combined average global land and ocean surface temperature records, July 2009 ranked fifth-warmest since 1880 when world-wide records began,  NOAA said.


Atlantic Ocean Daily Sea Surface Temps – POES Composite. Source: NOAA


East Pacific Ocean Daily Sea Surface Temps – POES Composite. Source: NOAA

The following stats were provided by NOAA:

Global Climate Statistics

  • The combined global land and ocean surface temperature for July 2009 was the fifth warmest on record, at 1.03 degrees F (0.57 degree C) above the 20th century average of 60.4 degrees F (15.8 degrees C).
  • The global ocean surface temperature for July 2009 was the warmest on record, 1.06 degrees F (0.59 degree C) above the 20th century average of 61.5 degrees F (16.4 degrees C). This broke the previous July record set in 1998. The July ocean surface temperature departure of 1.06 degrees F from the long-term average equals last month’s value, which was also a record.
  • The global land surface temperature for July 2009 was 0.92 degree F (0.51 degree C) above the 20th century average of 57.8 degrees F (14.3 degree C), and tied with 2003 as the ninth-warmest July on record.

Notable Developments and Events

  • El Niño persisted across the equatorial Pacific Ocean during July 2009. Related sea-surface temperature (SST) anomalies increased for the sixth consecutive month.
  • Large portions of many continents had substantially warmer-than-average temperatures during July 2009. The greatest departures from the long-term average were evident in Europe, northern Africa, and much of western North America. Broadly, across these regions, temperatures were about 4-7 degrees F (2-4 degrees C) above average.
  • Cooler-than-average conditions prevailed across southern South America, central Canada, the eastern United States, and parts of western and eastern Asia. The most notably cool conditions occurred across the eastern U.S., central Canada, and southern South America where region-wide temperatures were nearly 4-7 degrees F (2-4 degrees C) below average.
  • Arctic sea ice covered an average of 3.4 million square miles during July. This is 12.7 percent below the 1979-2000 average extent and the third lowest July sea ice extent on record, behind 2007 and 2006. Antarctic sea ice extent in July was 1.5 percent above the 1979-2000 average. July Arctic sea ice extent has decreased by 6.1 percent per decade since 1979, while July Antarctic sea ice extent has increased by 0.8 percent per decade over the same period.

Related Links:

Posted in dying oceans, oceans warming, POES, Record Ocean Surface Temps, Reynolds SST Analysis, Sea Surface Temp | Tagged: , , , , | 2 Comments »

Q. How Can You Tell When Ecosystem Nears Collapse?

Posted by feww on August 15, 2009

A. When 95 percent of the salmon don’t return to spawn!

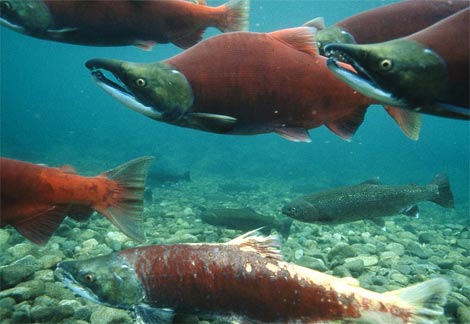
About 95 percent of sockeye salmon did not return to Fraser River on Canada’s Pacific Coast to spawn this summer

sockeye-salmon
Sockeye salmon. Photo sourced from here!

Nearly 11 million bright-red sockeye salmon that were expected to return to spawn on the Fraser River,  once known as the world’s most fertile spawning ground for sockeye, which empties into the Pacific ocean near Vancouver, British Columbia, have disappeared this summer. According to the Canadian government estimates fewer than 1 million returned, Reuters reported.

“The Canadian government has closed the river to commercial and recreational sockeye fishing for the third straight year, hitting the livelihood of nearby Indian reserves.”

“It’s quite the shocking drop,” said Stan Proboszcz, fisheries biologist at the Watershed Watch Salmon Society. “No one’s exactly sure what happened to these fish.”

Salmons hatch in freshwater rivers. They then migrate out to the ocean where they stay throughout their pre-reproductive age, and return as adult fish to spawn in natal rivers.

fraser river
Watershed of the Fraser River. The Fraser River is the longest river in British Columbia, Canada. Click on the map to enlarge.

The Canadian authorities have suggested a number of reasons for the sockeye’s disappearance:

  1. “Climate change may have reduced food supply for salmon in the ocean.” [i.e., they starved to death!]
  2. “The commercial fish farms that the young Fraser River salmon pass en route to the ocean may have infected them with sea lice, a marine parasite.” [Possibly, the most sensible of the three suggestions.]
  3. “The rising temperature of the river may have weakened the fish.” [By the time they enter the ocean, they lose their strength and the will to live and die off.]

“The Canadian government doesn’t know what’s killing the fish, but believes the sockeye are dying off in the ocean, not in fresh water, based on healthy out-migrations, said Jeff Grout, regional resource manager of salmon for the Department of Fisheries and Oceans.” Reuters reported.

This one made it, just. But not enough  happy returns!


A sockeye salmon scurries through shallow water in the Adams River while preparing to spawn near Chase, British Columbia northeast of Vancouver October 11, 2006. REUTERS/Andy Clark. Image may be subject to copyright.

Grout also revealed that Skeena River in northern British Columbia has experienced “lower-than-expected return” this summer, but could not elaborate  on the overall fate of the Pacific salmon fishery.

The reduced salmon return has multiple knock-on effect on the ecosystems around the Fraser River, Proboszcz said. Adult salmon die after spawning, creating a food source for bears and eagles and providing nutrients for plants.

“Food companies that rely on the Fraser for some of their salmon supply will have to look to other areas of British Columbia or Alaska, Grout said.”

What that means is that there would be even more pressure on other fisheries, which are already strained to the point of depletion and collapse.

The fact is our oceans are dying; they are pumped with unbelievable amounts of carbon dioxide, sulfuric acid [just two of the hundreds of gasses and chemicals humans release to the environment,] farm runoff, toxic chemicals, raw sewage, industrial waste, household garbage, the worst imaginable cocktail of poison from tourist and shipping boats, crude oil spills, nuclear waste/spills, oil and gas drilling waste …

Related Links:

Posted in collapsing fisheries, dying oceans, ecosystem collapse, Fish Eggs Holocaust, fishery collapse, knock-on effect, sockeye salmon | Tagged: , , , , | 3 Comments »