El Niño Update – 27 July 2009
Posted by feww on July 28, 2009
ENSO Cycle: Recent Evolution, Current Status and Predictions
The following UPDATE is prepared by
Climate Prediction Center / NCEP – 27 July 2009
The latest weekly SST departures are:
- Niño 4 ~ 0.6ºC
- Niño 3.4 ~ 0.9ºC
- Niño 3 ~ 1.0ºC
- Niño 1+2 ~ 0.6ºC

El Niño Map. [SOURCE: NOAA/ Climate Prediction Center / NCEP]
Niño Region SST Departures (ºC) – Recent Evolution

Summary
- El Niño conditions are present across the equatorial Pacific Ocean.
- Sea surface temperatures (SST) remain +0.5 to +1.5 above-average across much of the equatorial Pacific Ocean.
- Current observations and dynamical model forecasts indicate ElNiño conditions will continue to intensify and are expected to last through Northern Hemisphere winter 2009-10.
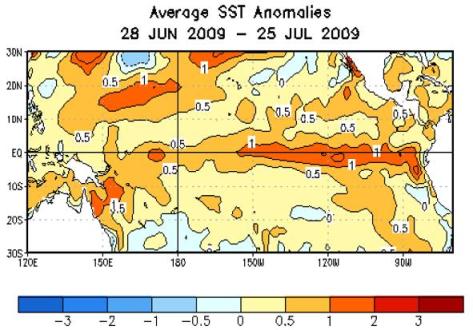
SST Departures (°C) in the Tropical Pacific

During the last 4-weeks, equatorial SSTs were at least +0.5°C above-average across the equatorial Pacific Ocean and at least +1.0°C above average in the east-central and eastern Pacific. [SOURCE: NOAA/ Climate Prediction Center / NCEP]
Global SST Departures

During the last four weeks, equatorial SSTs were above-average in the Pacific and Indian Oceans. Also, above-average SSTs covered large areas of the Northern Hemisphere mid-to-high latitudes. [SOURCE: NOAA/ Climate Prediction Center / NCEP]
Central & Eastern Pacific Upper-Ocean (0-300 m) Weekly Heat Content Anomalies

The upper ocean heat content was below-average across the eastern half of the equatorial Pacific Ocean between mid-August 2008 and March 2009, with a minimum reached in late December 2008. The heat content anomalies have remained positive since April 2009. [SOURCE: NOAA/ Climate Prediction Center / NCEP] Full Report
Related Links:
- Recognizing El Niño
- El Niño and La Niña: Tracing the Dance of Ocean and Atmosphere
- TAO Diagrams
- El Niño Forecasts
- El Niño Update – 20 July 2009
- El Niño Update # 1
- El Niño conditions is in progress —NOAA
- El Niño event almost certain: BOM
- El Niño could develop June – August 2009
- World Now
- El Niño [Main Page]
Notes:
1. NOAA Operational Definitions for El Niño and La Niña
- El Niño:characterized by a positive ONI greater than or equal to +0.5°C.
- La Niña:characterized by a negative ONI less than or equal to -0.5°C.
- By historical standards, to be classified as a full-fledged El Niño or La Niña episode,these thresholds must be exceeded for a period of at least 5 consecutive overlapping 3-month seasons.
- CPC considers El Niño or La Niña conditions to occur when the monthly Niño3.4 SST departures meet or exceed +/-0.5°C along with consistent atmospheric features. These anomalies must also be forecasted to persist for 3 consecutive months.
2. Oceanic Niño Index (ONI)
- The ONI is based on SST departures from average in the Niño 3.4 region, and is a principal measure for monitoring, assessing, and predicting ENSO.
- Defined as the three-month running-mean SST departures in the Niño 3.4 region. Departures are based on a set of improved homogeneous historical SST analysis (Extended Reconstructed SST –ERSST.v3b). The SST reconstruction methodology is described in Smith et al., 2008, J. Climate, vol. 21, 2283-2296.)
- Used to place current events into a historical perspective.
- NOAA’s operational definitions of El Niño and La Niña are keyed to the ONI index.
3. The most recent ONI value (April –June 2009) is +0.2oºC.
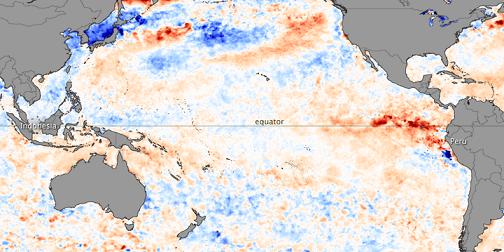
El Niño Conditions Set in Across Pacific Ocean [From NASA’s Earth Observatory]

El Niño conditions are evident in this sea surface temperature anomaly image based on data from the Advanced Microwave Scanning Radiometer for EOS (AMSR-E) on NASA’s Aqua satellite on July 26. The current data are compared to 12-year average temperatures (1985-1997) measured by the Advanced Very High Resolution Radiometers that have flown on several NOAA missions.
Cream-colored places represent near normal temperatures; red is warmer than normal temps; while, blue shows cooler than normal areas. The dark red area on the eastern Pacific off the coast of Peru and Ecuador (north of Peru) indicates much warmer than average temps. Across the Pacific, ocean temperatures around Indonesia were slightly cooler (light blue) than usual.
Earth’s largest ocean, the Pacific is the single biggest influence on the average temperature, rainfall, and vegetation conditions in the tropics. The Pacific’s primary climate pattern, the El Niño-Southern Oscillation (ENSO), includes an ocean component (the El Niño/La Niña pattern) and an atmospheric component, the Southern Oscillation.
Every 3-8 years, the prevailing easterly winds over the eastern equatorial Pacific weaken or reverse, surface temperatures in the central and eastern Pacific climb, and rainfall declines over most tropical land areas. In 1997-98, an El Niño event contributed to devastating fires in Indonesia’s tropical forests, releasing large amounts of greenhouse gases into the atmosphere, which completely destroyed the Mentawai coral reefs west of Sumatra.
El Niño ocean conditions does not guarantee full ENSO event. So far the atmospheric component of the pattern, the Southern Oscillation, isn’t fully cooperating. As of July 26, the trade winds in the western Pacific (near Indonesia) had shifted direction and were blowing weakly toward the east (see NOAA wind anomaly graphic), but across the central and eastern Pacific, easterly trade winds were still of average or slightly above-average strength. For an ENSO event to fully develop, the easterly trades will have to weaken across a much wider area of the Pacific than now.
NASA image by Jesse Allen, using AMSR-E data processed and provided by Chelle Gentemann and Frank Wentz, Remote Sensing Systems. Caption by Rebecca Lindsey. [Edited by FEWW.]

Leave a comment