Fire Earth

Earth is fighting to stay alive. Mass dieoffs, triggered by anthropogenic assault and fallout of planetary defense systems offsetting the impact, could begin anytime!

Archive for July 22nd, 2015

Record Warm June, First Half of 2015

Posted by feww on July 22, 2015

Record-breaking temps. over global land & oceans in June, 1st half of 2015, past 12 months

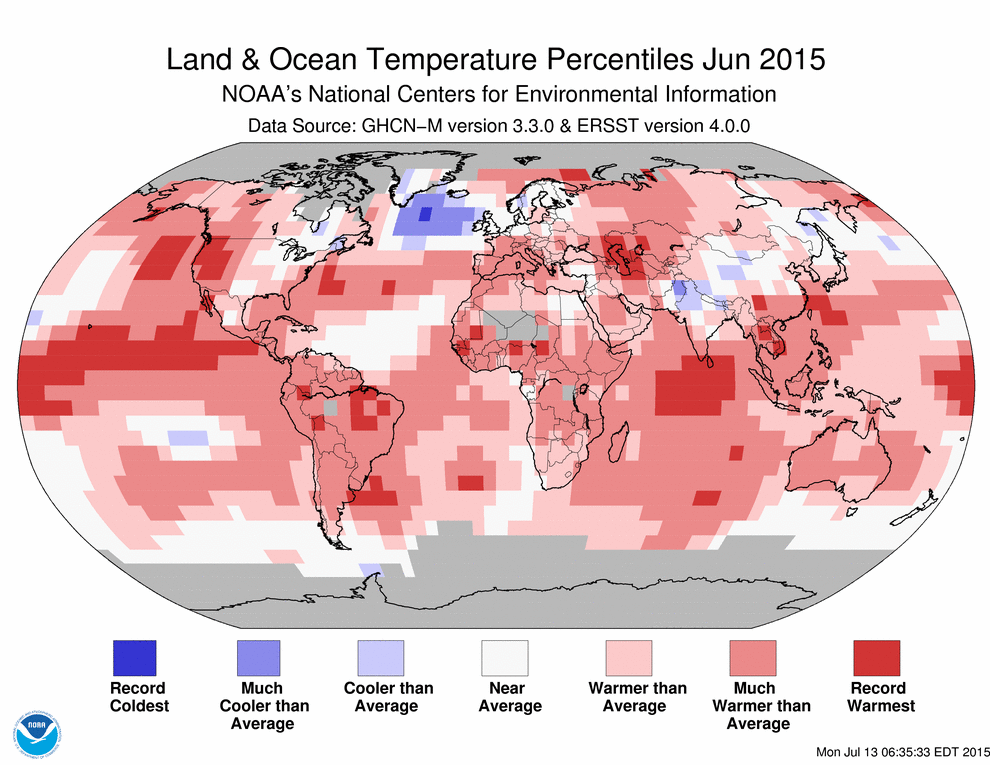
First half of 2015 was record warm for the globe, while June 2015 was warmest June on record, with global land areas and oceans each breaking previous records, according to The State of the Climate Report issued by NCDC/NOAA.

The following are some of the key highlights from the report:

Global highlights: Year-to-date (January–June 2015)

The globally averaged temperature across  land and ocean surfaces (SST) was  0.85°C (1.53°F) above the 20th century average, which was the highest for the 6-month period in the 1880–2015 record, surpassing the 2010 record by 0.09°C (0.16°F).

NOTES:
The
globally-averaged land and SST temperature for January to June 2010 was 14.2°C  (57.5°F), or 0.68°C (1.22°F) above the 20th century average.
The 20th century average land surface and SST temperature for January to June period, as quoted in 2014, was of 13.5°C (56.3°F)

The globally-averaged land surface temperature was 1.40°C (2.52°F) above the 20th century average, which was the highest for January–June in 136-year record, surpassing the 2007 record by 0.13°C  (0.23°F).

The globally-averaged SST was 0.65°C  (1.17°F) above the 20th century average, which was the highest for the 6-month period in the 1880–2015 record, surpassing the 2010 record by 0.07°F (0.04°C).

Global highlights: June 2015

The combined average temperature over global land and ocean surfaces for June 2015 was the highest for June in the 136-year period of record, at 0.88°C (1.58°F) above the 20th century average of 15.5°C (59.9°F), surpassing the previous record set just one year ago by 0.12°C (0.22°F). This was also the fourth highest monthly departure from average for any month on record. The two highest monthly departures from average occurred earlier this year in February and March, both at 0.90°C (1.62°F) above the 20th century average for their respective months, while January 2007 had the third highest, at 0.89°C (1.60°F) above its monthly average.

The average global temperature across land surfaces was 1.26°C (2.27°F) above the 20th century average of 13.3°C (55.9°F), the highest June temperature on record, surpassing the 2012 record by 0.06°C (0.11°F).

The global sea surface temperature for June was 0.74°C (1.33°F) above the 20th century average of 16.4°C (61.5°F), the highest for June on record, surpassing the 2014 record by 0.06°C (0.11°F). [This also tied with September 2014 as the highest monthly departure from average for any month for the globally-averaged sea surface temperature. Nine of the ten highest monthly departures from average have occurred since May 2014.]

June 2015 also marks the fourth month this year that has broken its monthly temperature record, along with February, March, and May. The other months of 2015 were not far behind: January was second warmest for its respective month and April was third warmest. These six warm months combined with the previous six months (four of which were also record warm) to make the period July 2014–June 2015 the warmest 12-month period in the 136-year period of record, surpassing the previous record set just last month (June 2014–May 2015). 

Rank
1 = Warmest
Period of Record:
1880–2015
12-month Period Anomaly °C Anomaly °F
1 July 2014–June 2015 0.83 1.49
2 June 2014–May 2015 0.82 1.48
3 May 2014–April 2015 0.81 1.46
4 April 2014–March 2015 0.80 1.44
5 March 2014–February 2015 0.79 1.42
6 (tie) January–December 2014 0.78 1.40
6 (tie) February 2014–January 2015 0.78 1.40
8 December 2013–November 2014 0.77 1.39
9 November 2013–October 2014 0.74 1.33
10 (tie*) October 2013–September 2014 0.73 1.31

*ties with four other 12-month periods.  NOAA National Centers for Environmental Information, State of the Climate: Global Analysis for June 2015, published online July 2015, retrieved on July 22, 2015 from http://www.ncdc.noaa.gov/sotc/global/201506.

Related Links

Posted in News Alert | Tagged: , , , , , | Leave a Comment »

First Half of 2015 Record Warm Globally

Posted by feww on July 22, 2015

Global land and oceans both record warm for June

First half of 2015 was record warm for the globe, while June 2015 was warmest June on record, with global land areas and oceans each breaking previous records, according to The State of the Climate Report issued by NCDC/NOAA.

The following are some of the key highlights from the report:

Global highlights: Year-to-date (January–June 2015)

The globally averaged temperature across  land and ocean surfaces (SST) was  0.85°C (1.53°F) above the 20th century average, which was the highest for the 6-month period in the 1880–2015 record, surpassing the 2010 record by 0.09°C (0.16°F).

NOTES:
The
globally-averaged land and SST temperature for January to June 2010 was 14.2°C  (57.5°F), or 0.68°C (1.22°F) above the 20th century average.
The 20th century average land surface and SST temperature for January to June period, as quoted in 2014, was of 13.5°C (56.3°F)

The globally-averaged land surface temperature was 1.40°C (2.52°F) above the 20th century average, which was the highest for January–June in 136-year record, surpassing the 2007 record by 0.13°C  (0.23°F).

The globally-averaged SST was 0.65°C  (1.17°F) above the 20th century average, which was the highest for the 6-month period in the 1880–2015 record, surpassing the 2010 record by 0.07°F (0.04°C).

Global highlights: June 2015

The combined average temperature over global land and ocean surfaces for June 2015 was the highest for June in the 136-year period of record, at 0.88°C (1.58°F) above the 20th century average of 15.5°C (59.9°F), surpassing the previous record set just one year ago by 0.12°C (0.22°F). This was also the fourth highest monthly departure from average for any month on record. The two highest monthly departures from average occurred earlier this year in February and March, both at 0.90°C (1.62°F) above the 20th century average for their respective months, while January 2007 had the third highest, at 0.89°C (1.60°F) above its monthly average.

The average global temperature across land surfaces was 1.26°C (2.27°F) above the 20th century average of 13.3°C (55.9°F), the highest June temperature on record, surpassing the 2012 record by 0.06°C (0.11°F).

The global sea surface temperature for June was 0.74°C (1.33°F) above the 20th century average of 16.4°C (61.5°F), the highest for June on record, surpassing the 2014 record by 0.06°C (0.11°F). [This also tied with September 2014 as the highest monthly departure from average for any month for the globally-averaged sea surface temperature. Nine of the ten highest monthly departures from average have occurred since May 2014.]

June 2015 also marks the fourth month this year that has broken its monthly temperature record, along with February, March, and May. The other months of 2015 were not far behind: January was second warmest for its respective month and April was third warmest. These six warm months combined with the previous six months (four of which were also record warm) to make the period July 2014–June 2015 the warmest 12-month period in the 136-year period of record, surpassing the previous record set just last month (June 2014–May 2015). 

Rank
1 = Warmest
Period of Record:
1880–2015
12-month Period Anomaly °C Anomaly °F
1 July 2014–June 2015 0.83 1.49
2 June 2014–May 2015 0.82 1.48
3 May 2014–April 2015 0.81 1.46
4 April 2014–March 2015 0.80 1.44
5 March 2014–February 2015 0.79 1.42
6 (tie) January–December 2014 0.78 1.40
6 (tie) February 2014–January 2015 0.78 1.40
8 December 2013–November 2014 0.77 1.39
9 November 2013–October 2014 0.74 1.33
10 (tie*) October 2013–September 2014 0.73 1.31

*ties with four other 12-month periods.  NOAA National Centers for Environmental Information, State of the Climate: Global Analysis for June 2015, published online July 2015, retrieved on July 22, 2015 from http://www.ncdc.noaa.gov/sotc/global/201506.

Related Links


Posted in News Alert | Tagged: , | Leave a Comment »

Disasters Displace 3 Percent of World Population in 7 Years

Posted by feww on July 22, 2015

One person displaced by a disaster every second, while one in every 122 humans is a refugee!

An estimated one person has been displaced by a disaster every second since 2008, with 19.3 million people forced to flee their homes in 2014 alone.

In 2014, 17.5 million people were forced to flee their homes due to disasters caused by extreme  weather events such as storms and flooding, while 1.7 million by geophysical hazards, especially earthquakes and volcanic eruptions, said  the Internal Displacement Monitoring Center (IDMC) of the Norwegian Refugee Council (NRC) in its global report released this week.

The report argues that these drivers are increasing the number of people becoming displaced, and the risk that their displacement becomes a long-term problem. Today, the likelihood of being displaced by a disaster is 60% higher than it was four decades ago, and an analysis of 34 cases reveals that disaster displacement can last for up to 26 years.

People in both rich and poor countries can be caught in protracted, or long-term, displacement. In the US, over 56,000 people are still in need of housing assistance following Hurricane Sandy in 2012, and 230,000 people have been unable to establish new homes in Japan following the 2011 earthquake, tsunami and nuclear accident.

Disasters displaced more than 19.3 million people in 100 countries last year, according to the NRC report.

  • Since 2008, an average of 26.4 million people have been displaced by disasters each year—equivalent to one person displaced every second.
  • Asia, home to 60% of the world’s population, and with 16.7 million people displaced, accounted for 87 per cent of the global total in 2014.
  • China, India and the Philippines experienced the highest levels of displacement in absolute terms, both in 2014 and for the 2008 to 2014 period.
  • Displacements of fewer than 100,000 people made up 95.4 per cent of the events recorded in 2014, but only 17 percent of the total number displaced.
  • Disasters caused by extreme weather events accounted for 86 percent of all displacements  in the 7-year report period (2008 to 2014), with the remaining 14 percent being due to geophysical events, such as earthquakes and volcanic eruptions.
  • In 2014, Europe experienced double its average level of displacement for the past seven years. 190,000 people were displaced in 2014, mostly by flood disasters in the Balkans.

Mandatory evacuation zones in Fukushima prefecture
Via NRC/ IDMC. Japan’s triple disasters, Tōhoku earthquake, the massive tsunami and the nuclear meltdowns, forced more than 470,000 people to flee their homes, and four years later about 230,000 are still displaced. [The monkey government of warmongering Shinzo Abe is more interested in throwing obscene amounts of money at the arms industry, instead of building new homes for its displaced and traumatized people.] “The mental and physical health of IDPs has also deteriorated. A 2015 survey of evacuees revealed that many from both inside and outside official evacuation zones were suffering from sleeping disorders, anxiety, loneliness and depression. Fukushima is the only prefecture where the number of deaths resulting from health issues and suicides related to the disaster has exceeded the toll from the direct impacts of the earthquake and tsunami.”

World at War: One in Every 122 Humans is a Refugee

UNHCR’s annual Global Trends Report: World at War, released on June 18, 2015 said that worldwide displacement in 2014 was at the highest level ever recorded.

An astounding 59.5 million people, a population the size of Canada and Australia combined, were forcibly displaced at the end of 2014, compared to 51.2 million a year earlier and 37.5 million ten years ago.

Posted in disaster watch, Displaced population, global disasters | Tagged: , , , , , | Leave a Comment »

3.1 Million Iraqis Displaced by Violence

Posted by feww on July 22, 2015

 9 Percent of remaining Iraqi population now displaced

More than 3.1 million Iraqis have been internally displaced by the ongoing bloody conflict, said UN spokesperson on Tuesday.

At least 300,000 people have been displaced from and within Anbar province including more than 250,000 individuals from Ramadi, the capital of governorate, since military operations began in April, said the UN Assistance (!) Mission for Iraq (UNAMI).

The DTM has identified 3,112,914 persons displaced by conflict in Iraq. The majority, 67 per cent, are sheltered in private settings that include rented housing, host families and hotels. A smaller but significant number, 20 per cent, are identified as living in critical shelter arrangements, which include unfinished buildings, religious buildings, informal settlements and schools. Eight per cent of those currently displaced in Iraq are living in camp settings.

A total of 1,466 Iraqis were killed and another 1,687 were injured in acts of terrorism, violence and armed conflict in June 2015, according to casualty figures released by UNAMI earlier this month.

In the first half 2015, at least 6,784 Iraqis were killed and 11,789 others wounded in acts of terrorism and violence.

Fighting to liberate the Anbar province continues between the Iraqi security forces, and the so-called Islamic State (ISIL) terrorists, better known as daesh , the thugs, assassins and murder mechanics left behind from the genocidal regime of Saddam-Hussein, who have seized most of the governorate.

*CAVEATS: In general, UNAMI has been hindered in effectively verifying casualties in conflict areas.  Figures for casualties from Anbar Governorate are provided by the Health Directorate and are noted below. In some cases, UNAMI could only partially verify certain incidents.  UNAMI has also received, without being able to verify, reports of large numbers of casualties along with unknown numbers of persons who have died from secondary effects of violence after having fled their homes due to exposure to the elements, lack of water, food, medicines and health care.  For these reasons, the figures reported have to be considered as the absolute minimum.

Posted in disaster watch, Global Disaster watch | Tagged: , , , , , , , , | Leave a Comment »