Fire Earth

Earth is fighting to stay alive. Mass dieoffs, triggered by anthropogenic assault and fallout of planetary defense systems offsetting the impact, could begin anytime!

Archive for the ‘CO2e’ Category

Sudden Surges in Atmospheric CO2: FIRE-EARTH Forecast

Posted by feww on July 23, 2013

Just when you thought it couldn’t possibly get much …

FIRE-EARTH Models show unprecedented surges in atmospheric CO2 concentrations starting 2014. The massive increases could be as much as 10 – 15 times any rises ever recorded.

To minimize abuse of this forecast by the usual culprits and dozens of newcomers, FIRE-EARTH won’t release further details at this time.

global co2 may2013
The graph shows recent monthly mean carbon dioxide globally averaged over marine surface sites. The Global Monitoring Division of NOAA/Earth System Research Laboratory has measured carbon dioxide and other greenhouse gases for several decades at a globally distributed network of air sampling sites [Conway, 1994]. A global average is constructed by first fitting a smoothed curve as a function of time to each site, and then the smoothed value for each site is plotted as a function of latitude for 48 equal time steps per year. A global average is calculated from the latitude plot at each time step [Masarie, 1995]. Go here for more details on how global means are calculated.  Click for a comparison with recent trends in carbon dioxide at Mauna Loa, Hawaii, which has the longest continuous record of direct atmospheric CO2 measurements. Image and caption: ESRL/NOAA

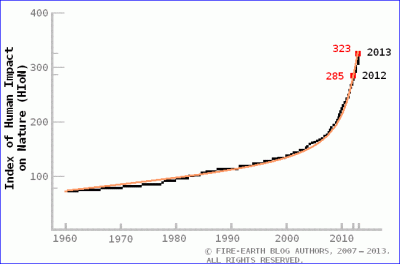
Index of Human Impact on Nature (HIoN)

FIRE-EARTH - HION Index - 1 JULY 2013 - hsc2
Diagram shows the exponential growth of Human Impact on Nature (HION) between 1960  and July 2013. Source: FIRE-EARTH Real-Time Earth Models. Copyright: FIRE-EARTH Blog Authors.

Related Links

Posted in carbon emissions, carbon footprint, CO2, CO2 Emissions, CO2e | Tagged: , , , , , , , , , | 1 Comment »

400 PPM

Posted by feww on April 3, 2013

Weekly average CO2 at Mauna Loa could hit 400ppm by May 2013: FIRE-EARTH

FIRE-EARTH projections show, based on the data provided by Mauna Loa Observatory, the average CO2 at Mauna Loa could climb to 400ppm in the next 6 weeks.

Up-to-date weekly average CO2 at Mauna Loa

  • Week of March 24, 2013:     397.92 ppm
  • Weekly value from 1 year ago:     395.30 ppm
  • Weekly value from 10 years ago:     377.06 ppm

CO2-1y-dwm
CO2 Daily and Weekly Means at Mauna Loa [April 2012 – March 2013.]  The weekly mean (red bar) is simply the average of all days in the week for which a background value could be defined. The average standard deviation of day to day variability, calculated as the difference from the appropriate weekly mean, equals 0.38 ppm for the entire record. As a visual aid, the blue lines present monthly means of background data as they are presented under Recent Monthly CO2 at Mauna Loa. [Source: ESRL/NOAA]  

Recent Mauna Loa CO2

  • February 2013:     396.80 ppm
  • February 2012:     393.54 ppm

CO2-mm-mlo
The graph shows recent monthly mean carbon dioxide measured at Mauna Loa Observatory, Hawaii. [Source:  ESRL/NOAA]

CO2-MLO
Monthly mean atmospheric CO2 at Mauna Loa Observatory, Hawaii [Source:  ESRL/NOAA]

Recent Global CO2

  • January 2013:     395.09 ppm
  • January 2012:     392.44 ppm

CO2-gl
The graph shows recent monthly mean carbon dioxide globally averaged over marine surface sites. [Images sourced from ESRL/NOAA]

Historic

Time history of atmospheric carbon dioxide from 800,000 years ago until January, 2012.

long-lived ghg
Global average abundances of the major, well-mixed, long-lived greenhouse gases – carbon dioxide, methane, nitrous oxide, CFC-12 and CFC-11 – from the NOAA global air sampling network are plotted since the beginning of 1979. These gases account for about 96% of the direct radiative forcing by long-lived greenhouse gases since 1750. The remaining 4% is contributed by an assortment of 15 minor halogenated gases (see text). Methane data before 1983 are annual averages from Etheridge et al. (1998), adjusted to the NOAA calibration scale [Dlugokencky et al., 2005].  Source: ESRL/NOAA.  Click on image to view larger image. Click HERE for full size figure .

Posted in carbon emissions, carbon footprint, CO2, CO2e, Global Disaster watch, global disasters, global disasters 2013, Significant Event Imagery, significant events | Tagged: , , , , , , , , | 1 Comment »

Greenhouse Gas Emissions – 2009 Report

Posted by feww on April 18, 2009

U.S. greenhouse gas (GHG) emissions rose 1.4 percent in 2007, the EPA reported.

The bulk of the increase in 2007 was due to a rise in CO2 emissions from additional fuel and energy consumption, the US Environmental Protection Agency (EPA) said.

A cooler winter and warmer summer in 2007, compared to the previous year, resulted in higher demand for heating fuel and electricity, the report said.

Additionally, the demand for fossil fuels to generate electricity rose  significantly compensating for a  sharp drop of about 14.2  percent in hydropower generation due to low water levels.

In 2007 the US emitted the equivalent of  7,150 million metric tons of carbon dioxide equivalent (CO2e) in six main GHGs: carbon dioxide, hydrofluorocarbons, methane, nitrous oxide,  perfluorocarbons and sulfur hexafluoride.

The EPA report components are available at: http://epa.gov/climatechange/emissions/usinventoryreport.html

EU says its GHG fell because it was warmer

EU says its greenhouse gas emissions fell by 1.2 percent in 2007 compared to the previous year because the winter was warmer.

“For the EU, there was a significant decline in the use of oil and gas, particularly in households [in 2007,]” said a report prepared for the EU Commission by the European Environment Agency.

While the energy prices rose steeply in 2007, the report cited a warmer winter as the main reason for a fall in demand for fossil fuels (oil, gas and coal).

Emission in the manufacturing sector fell, especially in  Britain, Italy and Spain, while the emissions for the power generators consuming fossil fuels rose, namely in  Germany, Greece, the Netherlands and Spain.

The 27-nation block  generated 5.56 billion tons carbon dioxide equivalent gases (CO2e) in 2007, a fall of  about 59 million tons, or 1.2 percent, compared to 2006 to emissions.   Germany and Britain, the top two EU emitters, saw a fall of 2.4 and 1.7 percent respectively, the report said.

According to the report, Latvia’s emissions in 2007 fell 54.7 percent below the 1990 level, while Spain saw a rise of 53.5 percent above their 1990 emission level.

Related Links:

Posted in Climate Change, CO2e, EPA 2009 report, hydropower, US emissions | Tagged: , , , , | Leave a Comment »

Protesters block runway at Scotland’s airport

Posted by feww on March 3, 2009

‘Plane Stupid’ protesters break through Aberdeen airport’s fence to block runway


Plane Stupid climate activists break through the perimeter fence at Aberdeen airport before setting up a barricade on an aircraft taxiway. Photograph: Plane Stupid. Creative Commons License.

Flights at Aberdeen airport one of Scotland’s main airports were disrupted this morning when a dozen protesters from the Plane Stupid campaign group cut through the airport’s perimeter fence at about 02:00 to  protest plans to expand the airport.

Airport operator BAA said flights to Amsterdam, London and Paris had been affected by the climate change activists.  Plane Stupid members locked themselves inside a “wire fortress” on a runway, as two protesters unfurled a banner on the terminal building.

“There have been two cancellations and some flights to and from the airport have been delayed due to the action,” A BAA spokeswoman told reporters.

Plane Stupid environmental activists managed to shut down London’s Stansted Airport for several hours in December 2008.

Protesters were dressed as golfers imitating Donald Trump, the New York property magnet, who is building a $1.5bn golfing resort north of Aberdeen and reportedly supports the airport’s expansion.

Ironically, Donald Trump was forced to resign last week from the board of Trump Entertainment Resorts, just days before the casino company filed for bankruptcy.

A  Plane Stupid members from Edinburgh reportedly said: “We have been failed by the generation of Donald Trump and [Scottish politician] Alex Salmond.

“Despite a catalogue of scientific reports warning them that they can’t keep on with aviation growth, they continue with disregard for all of us who will end up dealing with the impacts of the climate crisis.

“The reality is that our generation’s future is vanishing so that people like Donald Trump and his super-rich friends can jet into Aberdeen for a round of golf.”

Related News Links:

Related Links:

Posted in Alex Salmond, BAA, Climate Change, CO2e, Donald Trump | Tagged: , , , , | 2 Comments »

Japan’s CO2 at Record High

Posted by feww on November 13, 2008

Japan’s GHG emissions increased to 1.371 billion metric tons of CO2e in 2007/08

Japan’s greenhouse gas emissions increased by 2.3 percent last year reaching a record high in the year to March, making her Kyoto goals looking increasingly illusive.

Japan is now the fourth largest producer of GHG after China (more than 10 times the population of Japan), United States (about 2.5 times the population) and Russia.

Emissions increased to 1.371 billion metric tons of CO2 equivalent (CO2e) for 2007/08 fiscal year, the Ministry of the Environment reported.

About 93 percent of Japan’s GHG emissions is energy based (comes from fossil fuel consumption).  Japan was expected to cut emissions by about 13.5 percent to achieve its Kyoto 2008-2012 target.


GHG Emissions in Japan. Undated Photograph: PA/Haydn West. Source. Image may be subject to copyright.
Emission Data for Japan in 2007/08:

  • Greenhouse gas emissions total: 1.371 billion metric tons of CO2e in 2007/08 [UP from 1.340 billion tons in 2006/07 and 1.261 billion tons in the Kyoto Protocol’s benchmark year of 1990.
  • Manufacturers (energy-based): 476 MMT, up 3.6% from 2006/07, but down 1.3 percent from 1990, due to an increase in industrial output and higher per-kilowatt emissions.
  • Transportation-sector: 249 MMT of CO2e down 1.6 percent from the previous year due mainly to a decline in auto travel.
  • Service-sector: 233 MMT of CO2e, a rise of 1.2 percent (blamed on a hotter summer and colder winter compared with the previous year).
  • Household emissions: 180 MMT of CO2e, a rise of  8.4 percent (due to higher use air-conditioning).
  • Power Generation and oil refining: 78 MMT of CO2e, a rise 3.6 percent.

The electric power industry has a voluntary target for reducing CO2 emissions to 0.34 kg per kilowatt hour. However, their emission averaged 0.45 kg/kWhr in 2007/08, which means to meet Kyoto goals they need to reduce emissions by about 100 million MMT a year for the next four years, based on the estimated power generation of 931 billion kWhr.

[Note: All figures provided above should be independently verified!]

Related Links:

Posted in Climate Change, CO2e, Emission Data for Japan, environment, Fossil Fuel consumption | Tagged: , , , , | 3 Comments »

Could California Turn to Desert by 2011?

Posted by feww on June 5, 2008

Bets are on!

Schwarzenegger declares statewide drought

Gov. Arnold Schwarzenegger declared a statewide drought in California after two years of below-average rainfall. “We have a serious drought,” said Governor Schwarzenegger on Wednesday.

“For the areas in Northern California that supply most of our water, this March, April and May have been the driest ever in our recorded history,” Schwarzenegger said. “As a result, some local governments are rationing water, developments can’t proceed and agricultural fields are sitting idle.”

“We must recognize the severity of the crisis we face, so I am signing an executive order proclaiming a statewide drought and directing my Department of Water Resources and other entities to take immediate action to address the situation.”

The executive order enables water officials transfer water around California swiftly dealing with unusually dry conditions that are destroying crops, affecting water quality and creating extreme fire hazards across the state, one of the nation’s top farming regions.


To enlarge, right click on the image and select View Image

“Mr Schwarzenegger warned that conditions could be even worse next year if there was another dry winter. The governor wants voters to approve a $12 billion bond to fund delta, river and groundwater improvements, conservation and recycling efforts, and reservoirs. But legislators have not agreed to the plan despite ongoing negotiations with the administration.” USA today reported.

“This drought is an urgent reminder of the immediate need to upgrade California’s water infrastructure,” Schwarzenegger said. “There is no more time to waste because nothing is more vital to protect our economy, our environment and our quality-of-life.”

[Note: Gov Schwarzenegger’s statement is fundamentally flawed and factually incorrect because “to protect our economy,” i.e., business as usual, results in the destruction of “our environment” and therefore harms “our quality of life.”]

Related Links:

[Nothing short of a catastrophic ecosystem collapse would make humans change their unsustainable lifestyles!]

Posted in air soil and water pollutions, civilization, Climate Change, CO2, CO2e, Coastal areas, Collapsing Cities, conserve, economy, energy, environment, food, Global Warming, government, health, politics, Water pollution, water shortages | Tagged: , , , , , , , , , , , , , , , | Leave a Comment »

Arthur Starts the Hurricane Season

Posted by feww on June 1, 2008

Arthur Forms Punctually Near Belize City, Mexico

Tropical storm Arthur, Atlantic’s first named storm for 2008, lashed Mexico’s Yucatan peninsula with strong winds of about 40 mph (65 kph), dumping heavy rains on Saturday.


Infrared image GOES Floater (updated every hour or so). NOAA – National Hurricane Center

As if with clockwork precision, Arthur was formed just hours before the official June 1 start of the Atlantic hurricane season about 75 miles (125 km) northwest of Belize City, Mexico.

Alma, the tropical storm formed in the Pacific, fizzled out on Friday after sloshing Nicaragua’s Pacific coast, killing three people.

This graphic shows an approximate representation of coastal areas under a hurricane warning (red), hurricane watch (pink), tropical storm warning (blue) and tropical storm watch (purple). The orange circle indicates the current position of the center of the tropical cyclone. The black line and dots show the National Hurricane Center (NHC) forecast track of the center at the times indicated. The dot indicating the forecast center location will be black if the cyclone is forecast to be tropical and will be white with a black outline if the cyclone is forecast to be extratropical. If only an L is displayed, then the system is forecast to be a remnant low. The letter inside the dot indicates the NHC’s forecast intensity for that time. (Graph and caption NOAA)

Related Information:

Related Links:

Posted in air pollution, americas, Climate Change, climate refugees, CO2, CO2e, energy, environment, food, Global Warming, health, More Disasters, politics, Travel, Warming | Tagged: , , , , , , , , , , , , , , | Leave a Comment »

How Much Water?

Posted by feww on February 5, 2008

Water Facts

  • Total water on Earth: Approx 1.4 x 10^18 m³
  • Water in the oceans: 97.5% of the total
  • Volume of Fresh water: 35 x 10^15 m³ (0.25% of the earth’s total water). About 0.3% of the freshwater is held in rivers, lakes, and reservoirs and the remainder is stored in glaciers, permanent snow, and groundwater aquifers.
  • Water contained in the earth’s atmosphere: 13 x 10^12 m³
  • Water removed from the earth’s surface via evaporation: 577 x 10^12 m³ each year (only 14% of the water evaporation is from land).
  • Total annual precipitation falling on land: 115 x 10^12 m³ (20% of total evaporation – the 6% surplus water returns to the oceans via rivers.)
  • Total freshwater on Earth stored as groundwater: 11 x 10^15 m³ (30% of all freshwater).
  • Water collected in lakes and rivers: 110 x 10^12 m³ is held as groundwater (one hundredth of the total groundwater reserves)
  • Aquifers contribution to human water consumption: an estimated 30% [?] of all of the water used throughout the world.
  • Natural recharge rate for the aquifers: from 0.01% to 3% per year.
  • Estimated overdraft of global groundwater: 200 x 10^9 m³ or (twice the average recharge rate!)

What’s the big deal?

Humans are mining groundwater resources, especially the aquifers. Water withdrawal rates from aquifers are drastically higher than their natural recharge rates. In short, we are running out of water!

Water Footprint

Total global water footprint is 7,450 km³ per year (7,450Gm³ per year).

  • Water Consumption USA: 2,480m³/per capita/year (agricultural produce 65%; domestic consumption 8%; industrial goods 27%)
  • World average: 1,146m³/cap/yr
  • China: 700m³
  • Developing [poor] world: 545m³

Food production in the U.S. is responsible for 25% of the country’s toxic water pollution and 40% of the common water pollution.

wfpt.jpg
Average national water footprint per capita (m³/capita/yr). Green indicates a national average water footprint of equal to or smaller than global average. Countries marked in red have a larger water footprint than the global average. Source: A. Y. Hoekstra et al. 2005. Water footprints of nations: Water use by people as a function of their consumption pattern.

What to Do

World’s groundwater reserves are running out! Start conserving water before the earth’s water reserves run completely dry! The following links are portals for water saving measures:
Water sense
H2ouse water saver home


Bottled Water (2007 estimate)

  • Worldwide consumption: 200billion liters (L)
  • US share of the market: 35billion L
  • US Bottled Water Market: $12.5billion
  • US per capita consumption: 115L (annually)

How Much Energy?

Energy used for production and marketing of a 0.5L, or 500cc (17oz) bottle: 34.58MJ, equivalent to 1.017L of gasoline or 2.35kg of CO2 emissions.

Notes
1. Above calculation is based on 1000L of water that is pumped, bottled, delivered, sold and consumed locally, i.e., traveling a total distance of about 130 miles (209km) from source to mouth. The total energy required for production was calculated at 69,162,640kJ, equivalent to 2,034L of gasoline, or 4,699kg of CO2 emissions (Michael Bigelow et al , 2005, THE PIPE OR THE BOTTLE? A Case Study on Energy Consumption, Harvey Mudd College, University of Bradford, UK).

2. According to the above study, the energy requirement for delivering 1000L of tap water (Yorkshire, England) was about 269,345kJ (about 7.92L of petrol or approximately 18kg of CO2 emissions), making bottled water 257 times more energy intensive than the tap water.

3. Packaging and shrink-wrapping the bottled water (assumes locally produced water) is responsible for 97.8% of its energy costs.

4. For Bottled water imported by air add 4.5grams of CO2e equivalent greenhouse gases (per0.5-liter-bottle) for each mile of the journey.

5. One liter (L) is about 1.057 quarts, 33.827 fluid ounces, or 1/3.785 gallons.

Time to switch to tap water?

[Use an inexpensive charcoal filter for added safety!]

Main Entry: Drying Wells, Sinking Cities
Related Links: Death by Lethal Pollution

External links:

Posted in Bottled Water, CO2e, consumer, energy, lifestyle | Leave a Comment »