Archive for the ‘storm’ Category
Posted by feww on May 25, 2011
Climate change quick menu!
Powerful and dangerous storm system will develop across the central and southern Plains: NWS
“A powerful and dangerous late-spring storm system will develop across the central and southern Plains today as an upper level system and a parade of supporting upper level disturbances advance out of the Intermountain West. The result will be strengthening low pressure over Kansas by this afternoon and evening that will then move slowly but steadily eastward toward Missouri by later Wednesday. The storm system will be accompanied by a classic dryline signature across the southern Plains with a strong frontal zone that will stretch across the Midwest and well to the East into the Northeast.” National Weather Service (NWS) reported.
Residents of the southern Plains and Ohio Valley are advised to prepare for severe weather, including the probability of large and powerful tornadoes through Wednesday.
Weather Hazards Map

Click image to enter NWS portal.
Weather Forecast Map

Click images to enlarge.

Probability of a tornado within 25 miles of a point. See inset for the date and times. Hatched Area: 10% or greater probability of EF2 – EF5 tornadoes within 25 miles of a point. (More Info)

Probability of severe weather within 25 miles of a point. See inset for the date and times. Hatched Area: 10% or greater probability of significant severe weather within 25 miles of a point. (More Info)
Tornado Update for May 24, 2011
- A total of 491 severe weather reports received by SPC (preliminary data) of which 47 were tornado touch downs.
- Tornadoes reported in six states: Kansas, Colorado, Oklahoma, Virginia, Texas and Arkansas.
- At least 13 people were killed in 3 states (8 people in Oklahoma, 2 in Kansas, and 3 in Arkansas.)
- A twister killed at least two people in Kansas on Tuesday (as above.)
- One EF3 tornado reported in El Reno with winds of 151mph (243km/hr), as of posting.
Annual Tornado Report Map

Total Number of tornadoes: 1,115 reports (Tornado numbers are preliminary and subject to revision.)
Top Ten Tornado Days of 2011

Source: NWS/SPC
2011 Tornado Tabulation (by State)

Tornado Safety
Joplin Tornado Update
- Death Toll has risen to 124, and is still climbing.
- The number of residents unaccounted for stands at 1,500.
- At least 750 people have received hospital treatment.
- The tornado is upgraded to EF5 on the Enhanced Fujita Tornado Scale (see chart below) with winds exceeding 200 MPH (322 km/hr), NWS said.
- Much of the south side of Joplin has been levelled.
- At least 2,000 homes have been completely destroyed.
- Some 6,000 other structures have been damaged.
- An estimated 5,000 vehicles have been totaled/damaged.
- The Joplin tornado was the deadliest single twister to strike the United States since 1947.
The Enhanced Fujita Tornado Scale – Quick Chart
EF0: 65 TO 85 MPH
EF1: 86 TO 110 MPH
EF2: 111 TO 135 MPH
EF3: 136 TO 165 MPH
EF4: 166 TO 200 MPH
EF5: Wind speeds greater than 200 MPH
On March 1, 2011, FIRE-EARTH said:
Brace for the Worst Ever! Climatic Extremes, Primeval Geophysical Activities and WILD Weather to Wreak Mega Havoc in 2011/2012 and Beyond…
NOW IS THE PERFECT TIME TO POWER DOWN AND START THINKING HARD. Encourage your folks, friends and neighbors to join in!! BECAUSE for most of us the GAME would be OVER soon.
Flooding and fires, earthquakes and volcanic eruptions, deadly tornadoes and strong storms … are just some of the items you’ve ordered from the climate change quick menu!
Related Links
2011 Disasters
updated at 13:27 UTC on May 25, 2011
Posted in storm | Tagged: 2011 Disasters, Joplin Tornado Update, Midwest tornadoes, severe weather forecast, southern Plains, The Enhanced Fujita Tornado Scale, Tornado, Tornado Alley, Tornado forecast, US Tornado Alley | Leave a Comment »
Posted by feww on February 23, 2011
ATU to Live One More Day as a Cyclone
TC ATU Details at 12:32UTC on February 23, 2011
- Position: Near 29.8ºS, 177.6ºE
- Location: 900km NNE of Auckland, New Zealand
- Forward Speed: ~ 40kmph
- Movement: 135 degrees
- Max sustained winds: ~ 120kmph
- Max wind gusts: ~ 130kmph
- Max significant wave height: ~ 10m
- Estimated by FIRE-EARTH
“[TC ATU] is currently undergoing extra-tropical transition (ET) and is expected to complete ET by [February 24 at 06:00UTC] as it continues to accelerate along the southwestern periphery of a subtropical steering ridge into the mid-latitude westerlies.” JTWC said.

Click image to enlarge.
Related Links:
Posted in cyclone, storm | Tagged: TC ATU, Tropical Cyclone 17P | Leave a Comment »
Posted by feww on October 31, 2010
Tomas Strengthens to a Cat 2 Hurricane, Headed Toward Haiti
Hurricane Tomas, the 12th hurricane of 2010 Atlantic hurricane season, has strengthened in the eastern Caribbean and continues moving WNW, possibly toward Haiti.

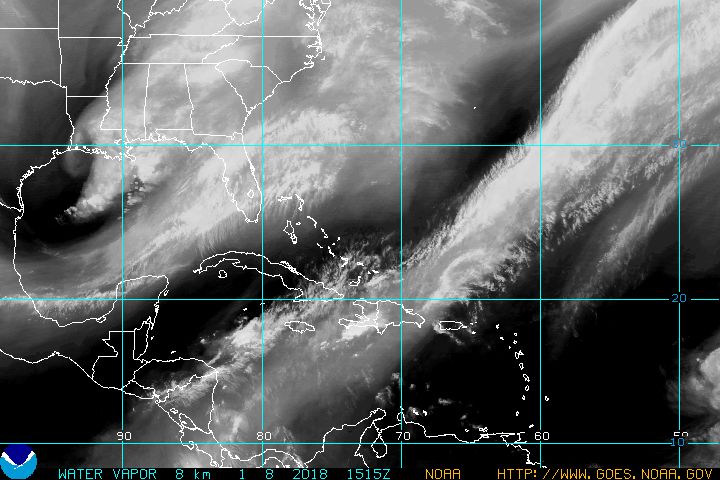
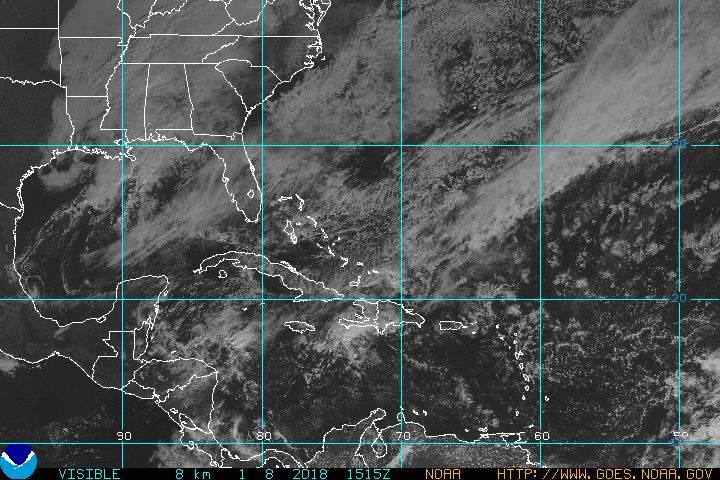
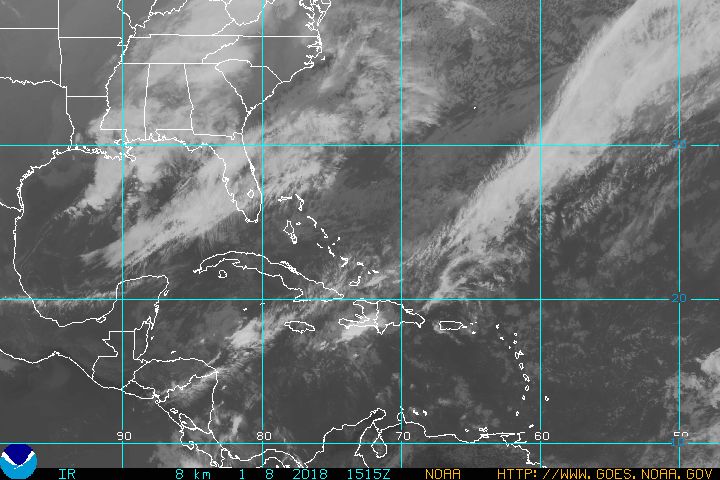
Hurricane Tomas. IR Satellite Image with projected trajectories superimposed. Source: NOAA/TPC via CIMSS. Click image to enlarge.
“The hurricane swept over St. Lucia and St. Vincent on Saturday, damaging homes, knocking out power and blocking roads with flooding and debris. There were no immediate reports of any deaths,” a report said.
“We have over 100 homes that have lost roofs. We expect that to increase,” said Michelle Forbes, head of the National Emergency Management Organization (NEMO) of St. Vincent.
Posted in 2010 Atlantic Hurricane Season, 2010 Hurricane Season, hurricane, storm, storm disaster | Tagged: Hurricane Tomas, Hurricane Tomas forecast trajectories, Hurricane Tomas projected paths, Hurricane Tomas projected trajectories, Hurricane Tomas satellite image | Leave a Comment »
Posted by feww on October 28, 2010
Typhoon CHABA strengthens to a cat. 4A force, may steer away from Japan
CHABA is moving NE with maximum sustained winds of about 225 km/hr [FEWW estimate]
See: FEWW New Hurricane Scale

Click image to enlarge. Source: Digital Typhoon

Typhoon CHABA – IR Satellite Image (NHC Enhancement) – 2km res. Source: CIMSS

Typhoon CHABA – IR Satellite Image (NHC Enhancement) – 4km res. Source: CIMSS

Typhoon CHABA Projected Paths. Source: CIMSS.
Posted in CHABA Satellite image, Japan Typhoons, severe storm, storm, typhoon CHABA | Tagged: cyclone, hurricane, Japan, typhoon, typhoon season | Leave a Comment »
Posted by feww on September 26, 2010
Matthew to dump about 10 inches of rain
Matthew had inundated vasts parts of Central America by midday Sunday
MATTHEW – Visible/IR Satellite Image

Tropical Storm MATTHEW – Visible/IR Satellite Image. Source: CIMSS. Click image to enlarge.

A woman washes clothes as she stands in flood waters near the Ulua River in the El Progreso neighborhood of Cortes, Honduras, Saturday Sept. 25, 2010. Tropical Storm Matthew caused flooding and thousands to evacuate. (AP Photo/Esteban Felix). Image may be subject to copyright.
Infrared Image of Tropical Storm MATTHEW Taken by NASA AIRS

Aqua satellite’s AIRS instrument generated infrared imagery of Matthew on Sept. 24 at 07:05 UTC (3:05 a.m. EDT). The coldest cloud top temperatures (colder than -63 Fahrenheit) appeared around the center of Matthew’s circulation already giving the appearance of an eye. Source: NASA

TRMM data from Sept. 24 at 0159 UTC showed moderate to heavy rainfall (red) southwest of Matthew’s center of circulation. The approximate center of circulation is shown by a red tropical storm symbol. Source: NASA
Related Links:
Posted in Central America flooding, storm, Tropical Storm Matthew | Tagged: Guatemala, Guatemala flooding, Guatemala landslides, storm MATTHEW | Leave a Comment »
Posted by feww on September 25, 2010
Tropical Storm MATTHEW Set to Dump 25cm of Rain Over Honduras
MATTHEW , the 13th named storm of the 2010 Atlantic hurricane season, threatens to inundate coffee and sugar fields that are already flooded by earlier rains

Tropical Storm MATTHEW – IR (NHC Enhancement). Source: CIMSS. Click image to enlarge.

Tropical Storm MATTHEW – IR-WV Diff. . Source: CIMSS. Click image to enlarge.

Tropical Storm MATTHEW – IR Satellite Image Projected Paths. Source: CIMSS. Click image to enlarge.
More rain in Guatemala could cause more deadly landslides. So far about 300 people have been killed by earlier storm-related disasters this year.
Related Links:
Posted in mudslide, Sinkholes, storm | Tagged: Guatemala flooding, Honduras flooding, MATTHEW Projected Paths, Tropical Storm MATTHEW, TS MATTHEW | Leave a Comment »
Posted by feww on September 24, 2010
Large Parts of Wisconsin and Southern Minnesota Inundated
The lingering storm system, which has dumped more than 33cm (13 inches) of rain over a swath of western Wisconsin and southern Minnesota since Wednesday, has flooded hundreds of homes forcing residents to be evacuated; many businesses have shut down; scores of schools are canceled in many communities; roads have been washed out; large segments of I-35 in the region are closed.

Click images to update.

Click Image to enlarge and update. (24-Hr FE ED).
TRMM Rain Accumulation

SPC Mesoscale Analysis

Click image to update.
- Sep 24, 2010 0100 UTC Day 1 Convective Outlook
- Sep 24, 2010 0600 UTC Day 2 Convective Outlook
Current NWS Weather Hazard Warnings (U.S.)
Related Links:
Posted in flood, flood disaster, flooding, severe storm, storm | Tagged: 2010 disasters, collapse, flooding upper midwest, Minnesota flooding, Wisconsin flooding | Leave a Comment »
Posted by feww on September 19, 2010
FANAPI Wreaks Havoc Across Taiwan
Typhoon FANAPI hit the island of Taiwan earlier today, forcing the closure of govt offices and schools, disrupting train services and flights, as the authorities evacuated up to 10,000 people in mountainous areas.

Typhoon FANAPI struck Taiwan on its way to China. Image source: CIMSS. Click image to enlarge.
FANAPI was a category 3 hurricane as it made landfall in Taiwan, delivering heavy precipitation and strong winds. The hurricane is expected to regain strength and strike South East China as a category 3B – 3C hurricane later on today or early tomorrow local time.
FANAPI was expected to cause substantial damage along its path over Taiwan.
When typhoon MORAKOT struck Taiwan last year, it killed about 1,000 people and left thousands more homeless.
Related Links:
Satellite Imagery (GOES 12 Floater/NOAA/SSD)
Loops/ Satellite Animations
Additional Satellite Images:
Posted in storm, STORM INFORMATION, typhoon FANAPI, typhoon hits Taiwan | Tagged: FANAPI, typhoon, Typhoon Morakot | 1 Comment »
Posted by feww on September 18, 2010
Fast-Moving Freak Storm Spawns Deadly Tornadoes in NYC

One of a dozens of cars crushed by fallen tree in Brooklyn. Photo credit: AP. Image may be subject to copyright.
A freak storm traveling from Staten Island across New York harbor, carved a 14-mile (22km) path of destruction from Brooklyn to the Bayside area in Queens, spawning a microburst with speeds of about 125mph (200 km/h), and two deadly tornadoes.
The tornadoes, which struck on Thursday, uprooted at least 1,000 trees, cut power to as many homes, crushing dozens of cars, and killing at least one person whose car was hit by a falling tree.
New York City was hit by tornadoes for the second time this year, but only 9th time since 1950, National Weather Service said.
Related Links:
Posted in Brooklyn tornado, storm, Tornado | Tagged: New York City, NYC, NYC microburst, NYC tornadoes | Leave a Comment »
Posted by feww on September 17, 2010
KARL, IGOR, JULIA and FANAPI
The Four Hurricanes

(L to R) Hurricanes KARL, IGOR, Julia and FANAPI. Image Source: CIMSS. Click image to enlarge.

KARL was a cat 3B hurricane as of posting [FEWW estimate.]. Image source: CIMSS. Click image to enlarge.

IGOR was a cat 4A hurricane as of posting [FEWW estimate.]. Image source: CIMSS. Click image to enlarge.

JULIA was a cat 1 hurricane as of posting [FEWW estimate.]. Image source: CIMSS. Click image to enlarge.

FANAPI, about 12 times larger than the are of its target, Taiwan, was a cat 2B hurricane as of posting [FEWW estimate.]. Image source: CIMSS. Click image to enlarge.
Related Links:
Satellite Imagery (GOES 12 Floater/NOAA/SSD)
Loops/ Satellite Animations
Additional Satellite Images:
Posted in hurricane, hurricane force, Hurricane IGOR, Hurricane JULIA, storm, storm disaster | Tagged: Hurricane FANAPI, Hurricane KARL | Leave a Comment »
Posted by feww on September 15, 2010
IGOR POWERS ON OVER ATLANTIC

Hurricane IGOR – IR (NHC Enhancement) Satellite Image. Source: CIMSS. Click image to enlarge.
Related Links:
Satellite Imagery (GOES 12 Floater/NOAA/SSD)
Loops/ Satellite Animations
Additional Satellite Images:
Posted in hurricane, storm | Tagged: Hurricane IGOR | Leave a Comment »
Posted by feww on September 12, 2010
Image of the Day
Hurricane IGOR Powers Up to a Cat 4C Force Moving West Over Atlantic
IGOR has strengthened to a Cat 4C hurricane over the Atlantic, spinning menacingly westward. IGOR should continue to become a super storm, but it’s highly uncertain right now whether it would make a landfall.
Summary of Hurricane’s Current Status:
- Location: Near 17.8N, 47.3W
- Max Sustained Winds: 240 km/hr
- Wind Gusts: 280 km/hr
- Movement: West (270 degrees) at 22 km/hr
- Position: 1,800km E of Saint Thomas, Virgin Islands
- Estimated by FEWW
- Source: JTWC and others
Hurricane IGOR: Target Uncertain!

Hurricane IGOR – IR (NHC Enhancement) Satellite Image. Source: CIMSS. Click image to enlarge.
Related Links:
POES Composite – (Daily Sea Surface Temps)
For more images and animation, click Satellite Imagery
For hurricane watches and warnings, click Hurricane IGOR Public Advisory
Posted in storm, super storm | Tagged: Hurricane IGOR, storm 11L | Leave a Comment »
Posted by feww on September 3, 2010
Earl Downgraded to a Cat 2 Hurricane, Still Dangerous
Hurricane earl batters North Carolina coast, moving north toward New England and Canada.

Hurricane Earl Is/IR Satellite Image. Source: CIMSS. Click image to enlarge.
Warnings and watches along the Atlantic coast include North Carolina, Virginia, Maryland, Delaware, New Jersey, New York, Connecticut, Rhode Island, Massachusetts, and Maine as well as several areas in Nova Scotia and New Brunswick provinces, Canada, a report said.

Hurricane Earl natural-color image captured by MODIS on NASA’s Terra satellite 15:29 UTC on September 2. “Earl shows visible characteristics of a powerful hurricane—large size, spiral arms, and a distinct eye. Clouds from Earl extend primarily over North Carolina and Virginia.” Source: NASA E/O. Click image to enlarge.
Related Links:
Posted in storm | Tagged: Hurricane EARL, hurricane Earl satellite images | Leave a Comment »
Posted by feww on September 2, 2010
What’s worse than a major hurricane making landfall?
EARL Now a Cat 4B Hurricane Packing Sustained Winds of 235km/hr, Intensifying

Hurricane EARL – GOES Satellite Floater Imagery. Click image to enlarge
Real-Time U.S. Composite Satellite Image

Animate image. Click image to enlarge.
Hurricane Earl

Hurricane EARL – natural-color image was captured by MODIS on NASA’s Aqua satellite at 2 p.m. EDT on September 1, 2010. The Bahamas are immediately west of the storm. Download large image (6 MB, JPEG) – Image acquired September 1, 2010. Click image to enlarge.
Hurricane Earl – The Astronaut View

This photograph was captured with a digital SLR camera by a NASA astronaut, Douglas Wheelock, on August 30, 2010, showing Earl with a distinct eye that spanned about 28 kilometers. Full caption here.
POES Composite – (Daily Sea Surface Temps)
Other Satellite Images o EARL

Satellite Imagery (GOES 12 Floater/NOAA/SSD). West Atlantic – IR (Aviation Color Enhancement). Click image to enlarge.

Loops/ Satellite Animations (GOES 12; NOAA/SSD). Tropical Atlantic Hurricane Sector – Infrared. Click image to animate.
For more images and animation, go to Satellite Imagery
Related Links:
Posted in hurricane, storm, storm disaster | Tagged: Hurricane EARL, hurricane Earl satellite imagery, hurricane warning | 1 Comment »
Posted by feww on August 31, 2010
Hurricane Season Could Get Busier Still

L-R: HURRICANE EARL, Tropical Storm FIONA, T.S. DANIELLE, Invest Area 98L, T.S. LIONROCK, T.S. NAMTHEUN, Typhoon KOMPASU. Click image to enlarge.
Hurricane EARL

HURRICANE EARL – IR (NHC Enhancement) Satellite Image. Source: CIMSS. Click image to enlarge.
Hurricane EARL: Summary of status at 11:10UTC on August 31, 2010 [Estimated by Fire-Earth]
- Location: Near 20.8N 67.1W
- Position: About 205 km (110NM) NNW of San Juan, Puerto Rico
- Max Sustained Winds: 225 km/hr
- Wind Gusts: 270 km/hr
- Movement: WNW (290 degrees) at 20 km/hr
- Max Wave Heights: 4.1m (12 feet)
- Sources: JTWC and others
Related Links:
Posted in hurricane, hurricane warning, storm, typhoon, typhoon KOMPASU | Tagged: 2010 atlantic hurricane season, Atlantic hurricane, Hurricane EARL, Puerto Rico, San Juan, TS LIONROCK, TS NAMTHEUN | Leave a Comment »
Posted by feww on August 23, 2010
Image of the Day:
The Three ‘Synchronized’ Storms

Source: CIMSS.
Posted in DANIELLE, MINDULLE, storm, Tropical storm FRANK, TS DANIELLE, TS FRANK | Tagged: 010 Atlantic hurricane season, tropical storms | Leave a Comment »
Posted by feww on August 11, 2010
TS DIANMU Strikes Southern Coast of Korean Peninsula

TS DIANMU– Visible Satellite Image (1km Res). Source: CIMSS. Click image to enlarge.

Dianmu winds topped speeds of 100 km/hr (gusts of 130 km/hr) before slamming into Korean Peninsula. The above natural-color image was captured by MODIS on NASA’s Terra satellite on August 10. Source: NASA E/O. Click image to enlarge. Download large image (5 MB, JPEG)
Posted in storm, Tropical storm, Tropical Storm watch, tropical storms, tropical storms 2010 | Tagged: DIANMU, Korean Peninsula, Tropical Storm DIANMU, TS DIANMU | Leave a Comment »
Posted by feww on August 4, 2010
Tropical Depression Four Strengthens into Tropical Storm Colin
Colin is the third tropical storm of the 2010 Atlantic hurricane season.

TS COLIN – IR (NHC Enhancement) Satellite Image. Source: CIMSS. Click image to enlarge.
TS COLIN Summary of status at 5:45UTC on August 04, 2010 [Estimated by Fire-Earth]
- Location: Near 16.9N 57.5W
- Position: About 465 km (250NM) NNE (27.3 degrees) of Barbados
- Max Sustained Winds: 60 km/hr
- Wind Gusts: 85 km/hr
- Movement: WNW (290 degrees) at 30 km/hr
- Max Wave Heights: 1.2m (4 feet)

A natural-color image of Tropical Storm Colin captured by MODIS on NASA’s Terra on 9:40 a.m. EDT (13:40 UTC). Click image to enlarge. Download large image (3 MB, JPEG)

Image shows the storm’s rainfall amounts, as measured by NASA’s TRMM, on August 2, 2010. Source: NASA. Click image to enlarge. Download large image (121 KB, JPEG)
Posted in Atlantic hurricane season, atlantic hurricanes 2010, environment, storm, Tropical Storm 04L, Tropical Storm Colin Satellite Images, tropical storms 2010 | Tagged: Atlantic hurricane season 2010, barbados, Tropical Storm Colin | 1 Comment »
Posted by feww on July 27, 2010
Deadly Storms Strike U.S. East Coast

Click image to enlarge.
Original Caption by NASA E/O: One of the most destructive storms in years struck Washington, D.C., and the surrounding area on July 25, 2010. Strong winds downed trees and power lines, leaving hundreds of thousands of residents without power, stopping elevators, and darkening malls and movie theaters. Falling trees killed at least two people. The following morning, crews were working furiously to restore power to homes, traffic lights, and even a water treatment plant.
The Geostationary Operational Environmental Satellite (GOES)—built and launched by NASA, and operated by the National Oceanic and Atmospheric Administration (NOAA)—captured a series of images of the storm activity on July 25, 2010. This image is a composite of clouds from GOES merged with background data of the land surface from NASA’s Moderate Resolution Imaging Spectroradiometer (MODIS). The animation shows a series of thunderstorms coalescing as the fast-moving front travels from the Appalachians toward the Mid-Atlantic. By 4:15 p.m. Eastern Daylight Savings Time, the strongest thunderstorms were directly over Washington, D.C.
The violent storms followed on the heels of relentless heat for the U.S. East Coast. “The East Coast has been baking for weeks,” explains George Huffman, a research meteorologist at NASA’s Goddard Space Flight Center. “It’s been hot and muggy, with lots of moisture in the air, and that stuff has been trapped under a high-pressure system. Storms had been steering around the edges of that system. In fact, the flight that experienced so much turbulence last week was along the edge of that high pressure.”
Forecasts had raised the possibility of severe weather for the East Coast on July 25, and Huffman watched the storm system as it traveled over Ohio and Pennsylvania, remaining intact as it moved. “You tend not to see well-organized lines of thunderstorms at 9:00 a.m.,” he says. But the storm system coming from the west did not dissipate, even in the mid-morning hours. “The large-scale pattern shifted, allowing the high pressure to our northwest, which is cooler and drier, to push toward the southeast. That push was strong enough to organize the squall lines that fed off of our hot, muggy conditions,” he explains. “As storms come across the mountains toward the coastal plain, they have three options: hang together, get stronger, or get weaker. This storm system got stronger.”
Seven months earlier, following the worst December snowstorm since 1909 that covered NE US under up to 20 inches of snow, Fire Earth said:
A Dry Run for Climate Chaos Heading Our Way

The Heaviest Blanket of Snow in 100 Years Covered Most of the Northeast US. The West Wing of the White House is seen buried under heavy snowfall December 19, 2009. Credit: REUTERS/Yuri Gripas. Image may be subject to copyright.
Related Links:
Posted in deadly storm, East Coast Storm, storm, US Land Temperatures | Tagged: impacts of climate change, violent storms, Washington DC storm | Leave a Comment »
Posted by feww on July 25, 2010
Delhi Dam in Eastern Iowa Collapses
The Delhi Dam in eastern Iowa collapsed about noon on Saturday, sending a wall of water smashing into the small town of Hopkinton (population 750).

Lake Delhi Dam Collapses. Source: KCRG. Image may be subject to copyright. See Fair Use Notice.
The collapse was “catastrophic,” a community leader said, blaming the cause on days of torrential rains which have buffered northeast Iowa.
The Maquoketa River, on which the dam was situated, record flood crest on Saturday, after 10 inches of rain fell in about 10 hours.
See also: Inflatable Dam Breaks at Tempe Town Lake
Powerful storms produce tornadoes and flooding in the Midwest
‘Powerful storms spawned by intense heat and humidity produced flooding and tornadoes in the Midwestern United States on Saturday, disrupting travel and cutting power to thousands of homes,’ a report said.

National Weather Forecast. Click image to update.
“A large area is being impacted by this system,” said a NWS forecaster.
“But some of the heavier rain totals … have been in Chicago. The water content in the atmosphere is very high.”
Much of Chicago and its suburbs were inundated after up to 7.5 inches of rain lashed the region in late Friday and Saturday’s storm.
A similar weather pattern has been developing in New York and Penn state. A tornado watch was issued for New York City and northern New Jersey.
“Wisconsin governor Jim Doyle declared a state of emergency on Friday after torrential rains flooded homes and opened sinkholes in Milwaukee and closed the city’s main airport,” according to the report.
NWS has issued severe weather alerts for numerous areas in Illinois, Indiana, Wisconsin, Iowa and Minnesota, as well as flood watches for tens of counties.

IR Satellite Image. Click Image to enlarge and update. (2

Click link to enter National Weather Service portal
Related Links:
Posted in disasters 2010, extreme rain event, Landslide, storm, US disasters | Tagged: chicago storm, Delhi Dam, Maquoketa River, sinkhole, sinkholes in Milwaukee | 1 Comment »
Posted by feww on July 21, 2010
CHANTHU Could Strike Zhanjiang, S. China as a Cat 3B Hurricane
CHANTHU Summary at 8:00UTC – July 21, 2010 [Estimated by Fire-Earth]
- Location: Near 19N, 113E
- Max Sustained Winds: 115 km/hr
- Wind Gusts: 140 km/hr
- Movement: West (275 degrees) at 12 km/hr
- Position: 450km SSW of Hong Kong
- Max Wave Heights: 6.5m (20 feet)
- Source: JTWC and others

TS CHANTHU – IR/Visible Satellite Image. Source: CIMSS. Click image to enlarge.

TS CHANTHU – Projected Path on IR/WV Diff image. Source: CIMSS. Click image to enlarge.
Related Links:
Posted in storm, Tropical storm, Tropical Storm 04W, Tropical Storm CHANTHU | Tagged: China Storm, Hong Kong, south china storm, Zhanjiang | Leave a Comment »
Posted by feww on July 18, 2010
CONSON Leaves 72 dead with at least 95 others missing in the Philippines and Vietnam
Typhoon CONSON (Basyang) claimed 68 lives in the Philippines with another 84 people reported missing. Up to 30,000 homes were reportedly destroyed or damaged.
At least 2 people were also killed in China, and 2 in Vietnam with 11 others reported as missing.
“Conson slammed into the country on Tuesday, directly hitting the capital Manila as it cut westward into the South China Sea with a ferocity that caught weather forecasters by surprise.” AFP reported.

Bystanders look at the body of a dead fisherman in Mariveles, Bataan. Credit: AFP. Image may be subject to copyright.
Typhoon CONSON lost most of it ferocity, slamming into northern Vietnam as a tropical storm late Saturday, having pummeled the Philippines and the Chinese island of Hainan earlier in the week. Thousands of people were evacuated from their homes in the north of Vietnam.
CONSON is downgraded to a tropical depression, but should continue to dump more rain in the mountainous areas in the north of Vietnam causing flash floods and landslides for another 48 to 72 hours.
Related Links:
Posted in Landslide, luzon flooding, storm, typhoon, Vietnam, Vietnam flooding | Tagged: CONSON Death Toll, Hainan, Typhoon CONSON | Leave a Comment »
Posted by feww on July 15, 2010
Image of the Day:
Tropical Storm Conson

TS Conson. Natural-color image of th estorm taken by MODIS on NASA’s Aqua satellite on July 14, 2010. Source: NASA E/O. Download large image (5 MB, JPEG). Click image to enlarge.
Related Links:
Posted in storm, typhoon | Tagged: Tropical Storm Conson, TS Conson | Leave a Comment »
Posted by feww on June 30, 2010
Storm Alex strengthens to a category 1A hurricane with sustained winds of about 120km/hr
ALEX, the first hurricane of 2010 Atlantic Hurricane Season, is also the first June hurricane in 15 years.

Hurricane ALEX – IR Satellite Image (NHC Enhancement). Source: CIMSS. Click image to enlarge

Hurricane ALEX – VIS/IR Satellite Image. Source: CIMSS. Click image to enlarge
HURRICANE ALEX — Summary of Status At 02:00UTC – June 30 [Fire-Earth Estimate]
- LOCATION: 23.3N, 94.6W
- Distances
- About 340km (210 miles) SE OF LA PESCA, Mexico
- About 420km (260 miles) SE of Brownsville, Texas
- Max. Sustained Winds 120km/hr (75MPH) —
- Currently Movement: WNW (286) at 19km/hr (12 MPH)
- Min Central Pressure 978 MB (28.88 inches)
Satellite Imagery (GOES 12 Floater/NOAA/SSD)
Loops/ Satellite Animations (GOES 12; NOAA/SSD)
Related Links:
Posted in atlantic hurricanes 2010, hurricane, storm | Tagged: FEWW New Hurricane Scale, gulf of mexico hurricane, hurricane alex, Storm alex | Leave a Comment »
Posted by feww on June 29, 2010
TS ALEX – UPDATE June 29
ALEX Standing Still in Southern Gulf of Mexico, Strengthening to a Hurricane
TS Alex could still surprise everyone by heading toward the leaking Macondo oil well, instead of moving as forecast.
Even on its projected path, Alex would create high winds and rough seas hampering the ‘cleanup’ operation.
TS ALEX At 00:00UTC – June 29
- LOCATION: 20.6N, 91.6W
- Distances
- About 675km (420 miles) ESE OF Tampico, Mexico
- About 845km (525 miles) SE of Brownsville, Texas
- Max. Sustained Winds 95km/hr (60MPH)
- Currently Movement: STATIONARY
- Min Central Pressure 990 MB (29.23 inches)

TS ALEX — IR Satellite Image. Source: CIMSS. Click image to enlarge

TS ALEX — GOM Wind Shear Diagram. Source: CIMSS. Click image to enlarge

ALEX Projected Paths –Source: CIMSS. Click image to enlarge
Related Links:
Satellite Imagery:
Satellite Imagery (GOES 12 Floater/NOAA/SSD)
Loops/ Satellite Animations (GOES 12; NOAA/SSD)
Related Links:
Posted in ALEX Projected Path, atlantic hurricanes 2010, storm, storm disaster, storm satellite imagery | Tagged: Alex in Gulf of Mexico, BROWNSVILLE, Tampico, Tropical Storm Alex, TS ALEX | Leave a Comment »


