Archive for the ‘Global Temperature’ Category
Posted by feww on January 22, 2014
2013 Ties with 2003 as the fourth warmest year on record: NCDC
2013 was the 37th consecutive year (since 1976) with the annual global temperature remaining above average.
Highlights from NCDC Report
- The combined land and ocean surface temperature was 0.62°C (1.12°F) above the 20th century average of 13.9°C (57.0°F).
- Currently, the warmest year on record is 2010 with the temperature 0.66°C (1.19°F) above average.
- 9 of the 10 warmest years since records began in 1880 have occurred in the 21st century.
- 1990, the third warmest year on record, is the only one of the top 10 records set in 20th century.

Global combined land and ocean annually-averaged temperature rank and anomaly for the 10 warmest years on record (since 1880). Tie is based on temperature anomaly in °C. Data Sourced from NCDC
Global Land Temperature
The average global land temperature in 2013 was 0.99°C (1.78°F) above the 20th century average and ranked as the fourth highest annually-averaged value on record.
Global Ocean Temperature
Globally-averaged ocean surface temperature in 2013 saw an anomaly of 0.48°C (0.86°F) above the 20th century average, tying with 2006 as the eighth warmest year on record, reported NCDC.
The departure was just 0.04°C (0.07°F) below the record high of 0.58°C (1.04°F), which was set in both 1998 and 2003.
NOTE: The 1901-2000 average combined land and ocean annual temperature is 13.9°C (56.9°F), the annually averaged land temperature for the same period is 8.5°C (47.3°F), and the long-term annually averaged sea surface temperature is 16.1°C (60.9°F).
Some 151 weather/climate disasters have occurred between 1980 and 2013, with the overall damages/costs reaching or exceeding $1 billion (including CPI adjustment to 2013). The total cost of these 151 disasters exceeds $1 trillion, according to NCDC.
The 2013 toll of billion-dollar weather and climate disasters across the United States stands at 7 events, which included five severe weather and tornado episodes, a major flood episode, and the western drought/heat wave.
Posted in Climate Change, environment, Global Disaster watch, global disasters, global disasters 2013, Global Temperature, Global temperature anomaly, significant events | Tagged: Billion-Dollar Climate Disasters, billion-dollar disasters, Global Temperature Analysis, NCDC, Sea Surface Temperature, Top 10 Warmest Years | 1 Comment »
Posted by feww on August 7, 2013
The following excerpts are from ‘State of the Climate in 2012,’ a 2-dimentional annual report prepared by the American Meteorological Society (AMS), with researchers from NOAA’s National Climatic Data Center in Asheville, NC acting as lead editors.
.
Earth more rapidly warming since 1970: Report
Since 1976, the earth has experienced annual temperatures above the long-term average. The rate of warming is 0.06°C (0.11°F) per decade since 1880 and a more rapid 0.16°C (0.28°F) per decade since 1970, according to the 2012 annual report from NOAA’s National Climatic Data Center.

Earth’s average annual surface temperature is higher today than it was when record keeping began more than a century ago. The red line shows how far above or below the 1981–2010 average (dashed line at zero) the combined land and ocean temperature has been each year since 1880. The data shown are from NOAA’s National Climatic Data Center, one of several temperature analyses included in the State of the Climate in 2012, all of which show a similar warming trend. Graph adapted from Figure 2.1, in BAMS State of the Climate in 2012.
The largest of warm anomalies in 2012 were observed across the Northern Hemisphere higher latitudes: The United States, Canada, southern Europe, western Russia and the Russian Far East, said the report.
Sea levels reached record highs in 2012. Globally, sea level has been increasing at an average rate of 3.2 ± 0.4 mm per year over the past two decades.
The global surface temperature ranked among the top 10 warmest years on record. Over land and ocean combined, 2012 was between 0.14° and 0.17° Celsius (0.25°and 0.31° Fahrenheit) above the 1981–2010 average, depending on the analysis. The globally averaged annual temperature over land was 0.24°–0.29°C (0.43°-0.52°F) above average. And averaged globally, the 2012 ocean temperature was 0.10°–0.14°C (0.18°-0.25°F) above average. [NOAA]

Surface temperatures in 2012 compared to the 1981-2010 average. NOAA map by Dan Pisut, NOAA Environmental Visualization Lab, based on based on Merged Land and Ocean Surface Temperature data from the National Climatic Data Center. Full report is posted HERE.
Related Links [External]
Posted in Global Temperature, global Temperature Anomalies, Significant Event Imagery, significant events | Tagged: 10 warmest years, 2012 State of the Climate, Earth's Surface Temperature, Global Surface Temperature Anomaly 2012, Global weather records, Sea level rise, State of the Climate | Leave a Comment »
Posted by feww on June 5, 2013
Death Valley World Record High Temperature of 134ºF Could Be Shattered in 2013
FIRE-EARTH Models show the world record high temperature of 134ºF set 100 years ago cold be broken this year with a probability of about 78 percent [probability revised up after running additional simulations – June 5, 2013.]
The world’s highest reliably recorded air temperature was 134°F (56.7°C) set at Furnace Creek Ranch (formerly Greenland Ranch) in Death Valley, California on July 10, 1913.
Excessive Heat Watch for Mojave Desert
Meantime, NWS issued an Excessive Heat Watch for SE Calif., S Nevada and NW Arizona.
- HIGH TEMPERATURES ARE EXPECTED TO CLIMB TO POTENTIALLY DANGEROUS LEVELS FOR
THIS TIME OF YEAR FRIDAY THROUGH SUNDAY
- Very hot weather is expected across the region this weekend as high pressure builds overhead. An Excessive Heat Watch is in effect starting Friday afternoon and continuing through Sunday evening for elevations in the Mojave Desert below 4000 feet.
- Expected Temperatures: HIGHS ranging from 105 to 110 for much of the MOJAVE DESERT region including Las Vegas Valley, 110 to 114 along the Colorado river Valley and from 119 to 123 degrees at Furnace creek in DEATH VALLEY national Park
Related Links
Posted in Global Disaster watch, global disasters, global disasters 2013, Global Temperature, global Temperature Anomalies, Significant Event Imagery, significant events | Tagged: Death Valley, Excessive Heat Watch, Furnace Creek Ranch, Heat from Hell, Mojave Desert, US Drought, World Record High Temperature | 1 Comment »
Posted by feww on January 9, 2013
Global Disasters/ Significant Events
2012 warmest year on record for continental U.S.
The Lower 48 experienced its warmest year on record in 2012 as the average temperature rose to 12.9°C (55.3°F), some 1.8°C (3.2°F) above the 20th century average, and 0.6°C (1.0°F) above 1998, the previous warmest year, NOAA reported.

Every state in the contiguous U.S. had an above-average annual temperature for 2012. Nineteen states had a record warm year and an additional 26 states had one of their 10 warmest. Source: NOAA
Other Highlights
- 2012 was the 2nd most extreme year on record for the country, according the U.S. Climate Extremes Index. “The index, which evaluates extremes in temperature and precipitation, as well as landfalling tropical cyclones, was nearly twice the average value and second only to 1998. To date, 2012 has seen 11 disasters that have reached the $1 billion threshold in losses, to include Sandy, Isaac, and tornado outbreaks experienced in the Great Plains, Texas and Southeast/Ohio Valley.”
- The average precipitation total for the contiguous U.S. for 2012 was 67.5 cm (26.57 inches), 6.5 cm (2.57 in) below average.
- The 2012 drought plagued 61 percent of the U.S. at its peak in July. “The dry conditions proved ideal for wildfires in the West, charring 9.2 million acres — the third highest on record.”

Annual Extremes: Several locations throughout the United States experienced temperature and precipitation extremes in 2012. Most striking was the number of locations across the country that broke their average annual temperature record. These records were primarily driven by extremely warm maximum day time temperatures or daily highs, especially during the spring and summer months. More than a dozen of these locations also experienced their driest year on record. In those areas, the combination of the extreme warm and dry period resulted in a drought comparable to the drought episodes of the 1950s. Source: NOAA/NCDC
Significant weather and climate events- Preliminary

Significant weather and climate events- preliminary
GLOBAL WARNINGS
.
DISASTER CALENDAR SYMBOLIC COUNTDOWN: 1,158 Days Left
[January 9, 2013] Mass die-offs resulting from human impact and the planetary response to the anthropogenic assault could occur by early 2016.
- SYMBOLIC COUNTDOWN: 1,158 Days Left to the most Fateful Day in Human History
- Symbolic countdown to the ‘worst day’ in human history began on May 15, 2011 ...
Posted in extreme climate, extreme climatic events, Extreme temperatures, Extreme weather condition, extreme weather conditions, Extreme Weather Event, Global Disaster watch, global disasters, global disasters 2012, global disasters 2013, global drought, Global Temperature, Global temperature anomaly | Tagged: 2012, billion-dollar disasters, Billion-dollar disasters of 2012, Climate Change, Rising Heat, Significant weather and climate events, U.S. Climate Extremes Index, U.S. temperature 2012, warmest year on record | Leave a Comment »
Posted by feww on January 8, 2013
DISASTER CALENDAR SYMBOLIC COUNTDOWN: 1,159 Days Left
[January 8, 2013] Mass die-offs resulting from human impact and the planetary response to the anthropogenic assault could occur by early 2016.
- SYMBOLIC COUNTDOWN: 1,159 Days Left to the most Fateful Day in Human History
- Symbolic countdown to the ‘worst day’ in human history began on May 15, 2011 ...
.
Global Disasters/ Significant Events
Australia: Entombed by a ‘dome of heat’
Hundreds of fires fanned by record temperatures and high winds are currently burning across Australia, many of them out of control.
About 90 percent of New South Wales (NSW) was in severe danger, with “catastrophic” conditions declared in five areas: the Illawarra, Shoalhaven, the Southern Ranges, the northern and eastern Riverina and southern parts of the lower Central West Plains.
- Temperatures soared to near 46ºC (118ºF) today.
- Australia’s Bureau of Meteorology (BOM) has forecast temperatures of up to 54ºC (129ºF) in central Australia next Monday and has accordingly extended its temperature chart by adding two new colors, pink and purple, to allow for the extremes.
- High winds and atmospheric conditions have created a ‘dome of heat’ entombing Australia, experts said.
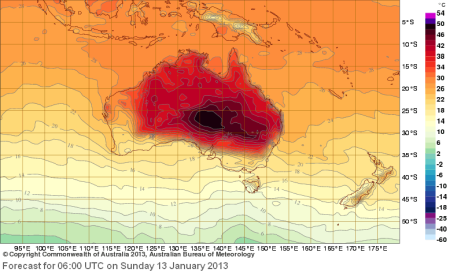
Australia Forecast Map for 06:00 UTC on Saturday 12 January 2013 . Source: BOM

Global Temperature Forecast Map for 06:00 UTC on Saturday 12 January 2013 . Source: BOM
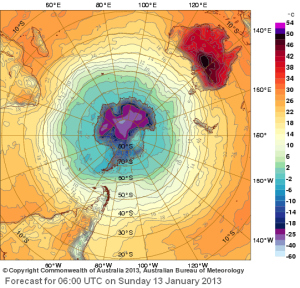
SH Temp Forecast for 06:00 UTC on Sunday 13 January 2013
Power Outages
“The blistering heat also caused a blaze at a nuclear research facility in southern Sydney after cabling overheated in a nearby electricity substation, while thousands of homes in the city’s north experienced power outages due to soaring demand,” said a report.
FEWW Links and Forecasts
Global Disasters: Links, Forecasts and Background
GLOBAL WARNING
Posted in environment, Global Disaster watch, global disasters, global disasters 2012, global disasters 2013, global drought, Global Temperature, global Temperature Anomalies, Global temperature anomaly, global temperatures | Tagged: Australia Back-to-Back Disasters, australia heatwave, Australia on fire, australian bushfire, australian wildfire, Back-to-Back Disasters, Black Saturday, Bushfire, catastrophic fire, dome of heat, Extremes of Temperature, Global Temperature Forecast Map, Great Dividing Range, nuclear research facility, Sydney, Temperature Forecast Map, wildfire | Leave a Comment »
Posted by feww on October 19, 2012
U.S. drought retreats fractionally, expected to persist through winter
Abnormally Dry to Exceptional Drought conditions (D0 to D4 drought levels on the U.S. Drought Monitor scale) now cover 74.98 percent of Continental United States, down from 76.72 percent last week, due to multiple storm system moving across the country.
U.S. Drought Map

U.S. Drought Map, October 16, 2012. Released by US Drought Monitor on October 18, 2012.
“The large majority” of the drought is expected to persist, however, and spread westward, said deputy director of NOAA.
“We even see drought expanding westward … into Montana, Idaho and part of Oregon and Washington.” He said.
Forecasters at NOAA also predict a dryer-than-usual and warmer winter.
“The main issues facing the U.S. going into this (winter) outlook period stem from persistent heat and drought,” chief of climate monitoring at NCDC told Reuters. “It is likely that 2012 will be the warmest of the 118-year record for the contiguous United States.”
2012 Drought Disaster Update
USDA has designated 2,673 counties as agricultural disaster areas. The designations, which extend across 47 states and D.C., include 2,234 counties listed as primary and 439 as contiguous disaster areas, as of October 17, 2012.

Total All Crop Approved Designations Disaster Incidents as of 10/17/2012- USDA Farm Service Agency Production, Emergencies and Compliance Division. NOTE: The above map does NOT appear to have been fully updated.
CONTINUED…
Posted in Global Disaster watch, global disasters, global disasters 2012, global drought, Global Temperature, global Temperature Anomalies | Tagged: 2012 Drought Disaster, Agri Disaster Areas, carrying capacity, crop disaster, Drought, drought 2012, drought and deluge, drought disaster, drought disaster areas, human impact, U.S. Collapse, U.S. Disaster Areas, U.S. Drought, U.S. Drought Disaster, U.S. Drought Map, U.S. Drought Monitor, U.S. Drought Update | Leave a Comment »
Posted by feww on September 18, 2012
Global Land Temperature: Second Warmest August on Record
Average temperature over global land and ocean surfaces was the 4th highest on record for August, at 61.22°F (16.22°C) or 1.12°F (0.62°C) above the 20th century average, NOAA reported.
- August 2012 was the 36th consecutive August and 330th consecutive month with a global temperature above the 20th century average.
- Global land temperature was 58.52°F, which tied with 2001 and 2011 as the second warmest August on record, behind 1998.
- Temperature for global land and ocean surfaces for June–August tied with 2005 as the third highest on record for this period at 61.25°F (16.24°C), or 1.15°F (0.64°C), above the 20th century average.
Related Links
GLOBAL WARNING
Posted in Climate Change, Global Disaster watch, global disasters, global disasters 2012, Global Temperature, global Temperature Anomalies, global temperatures | Tagged: Anthropogenic Global Warming, Average temperature, Climate Change, Global Climate Extremes, global deluge, Global Disaster watch, Global Disasters, global disasters 2012, global heating, global land and ocean, global land and ocean temperature, Global SST anomalies, Global Temperature, Global Temperature Anomalies, Global Temperatures | Leave a Comment »
Posted by feww on September 11, 2012
Drought-related stress affecting 80% of U.S. corn and soybeans, causing crops failure
The January-August 2012 was the warmest first 8 months of any year on record for the contiguous United States. The national temperature of 58.7°F (14.3°C) was 4.0°F above the 20th century average, and 1.0°F above the previous record warm in 2006, NOAA said.
- Summer 2012 was the 3rd hottest summer on record for the contiguous United States since recordkeeping began 117 years ago. [ 2011 and 1936 had higher summer temperatures for the Lower 48.]
Temperature Anomalies, June – August 2012

Reds show June-August temperatures up to 8° F warmer than average. Blues show temperatures up to 2° F cooler than average—the darker the color, the larger the difference. Source: NOAA climate.gov
- During the period, 33 states had record warm and an additional 12 states experienced top ten warm.
- The average temperature for the Lower 48 between June and August was higher than 74°F (24.3°C), which is more than 2° F above the 20th century average.
- “The average global temperature across land and oceans during July 2012 was 0.62°C (1.12°F) above the 20th century average of 15.8°C (60.4°F) and ranked as the fourth warmest July since records began in 1880. The previous three months—April, May, and June—also ranked among the top five warmest for their respective months. July 2012 marks the 36th consecutive July and 329th consecutive month with a global temperature above the 20th century average.” NOAA reported.
GLOBAL WARNING
Posted in Anthropogenic Global Warming, global climate, global climate change, Global Climate Extremes, global deluge, Global Disaster watch, global disasters, global disasters 2012, global drought, global heating, global Precipitation, global precipitation patterns, Global SST anomalies, Global Temperature, global Temperature Anomalies, global temperatures | Tagged: 330th consecutive month, Average temperature, contiguous United States, drought 2012, drought disaster, hottest summer, hottest YTD, Lower 48 summer temperature, U.S. Drought, warmest first 8 months | Leave a Comment »
Posted by feww on September 6, 2012
Hundreds of additional counties across 19 states declared disaster areas
About 400 additional counties* across 19 states have been declared agricultural disaster areas, mostly due to the ongoing drought, by the U.S. Department of Agriculture (USDA).
The disasters have occurred in the following states:
- California, Delaware, Idaho, Illinois, Indiana, Iowa, Kentucky, Maryland, Michigan, Minnesota, Montana, Nevada, North Dakota, Ohio, Pennsylvania, South Dakota, Tennessee, Virginia and Wyoming.
[NOTE: The above figure includes both primary and contiguous disaster areas. Duplications have occurred due to multiple disaster designations.]

U.S. Drought Disaster Map, September 5, 2012. Source: USDA. Edited for brevity by FIRE-EARTH.

U.S. Drought Map, September 4, 2012.
As of September 4, 2012, Abnormally Dry to Exceptional Drought levels (drought conditions D0 – D4 on the US Drought Montor chart) covered 77.69% of Contiguous U.S., 80.57% of Hawaii, 29.28% of Alaska and 33.34% of Puerto Rico, according to the U.S. Drought Monitor.
Related Links
Drought – Recent Links
Global Disasters: Links, Forecasts and Background
Global Warning
Posted in Global Disaster watch, global disasters, global disasters 2012, global drought, global heating, Global Temperature | Tagged: Agricultural disaster, carrying capacity, contiguous disaster areas, Drought, drought 2012, drought and deluge, drought disaster, Drought Disaster 2012, drought disaster area, drought disaster areas, Primary Disaster Areas, U.S. Disaster Areas, U.S. Drought Disaster, U.S. Drought Map, U.S. Drought Monitor, USDA | Leave a Comment »
Posted by feww on September 4, 2012
Major wildfires raging in California, Colorado, Idaho, Montana, Nebraska and Wyoming
Active wildfires are consuming more than a million acres across the West and Midwest, forcing thousands to evacuate.
- Red Flag Warnings are in effect in parts of the Dakotas, Idaho, Montana, Nebraska, and Wyoming.
- Oregon. USDA has designated seven counties in Oregon as primary and contiguous disaster areas due to damages and losses caused by wildfires that began July 8 and continue. The disaster declaration extends to counties in the adjacent states:
- Idaho. Four counties.
- Nevada. Two counties.
U.S. Weather Outlook
- ‘High temperatures in the upper 90s to around 100 degrees with heat index values approaching 110 degrees are expected from the Plains of southeast Kansas and eastern Oklahoma into the Lower Mississippi River Valley on Monday afternoon.’ NWS forecast.
- ‘Tropical moisture associated with the remnants of Isaac interacting with a frontal system will bring a flash flooding threat to the East Coast on Tuesday. Showers and thunderstorms will be capable of producing heavy rainfall that could lead to incidents of flash flooding.’
Other Global Disasters/ Significant Events
- United States. Hurricane ISAAC caused “enormous devastation” to the Gulf Coast, especially the state of Louisiana, officials said.
- The storm killed at least seven people—5 in New Orleans and 2 in Mississippi.
- Thousands of evacuees are still in shelters, or with friends and relatives.
- ISAAC knocked out power to about a million people in 5 states—Alabama, Arkansas, Louisiana, Mississippi and Texas.
- Korean Peninsula. Death toll from Typhoon BOLAVEN has climbed to about 100 across the Korean Peninsula, with many more injured. Dozens of others are reported as missing.
- The storm destroyed or damaged thousands of homes, and more than 50,000 hectares of farmland, leaving at least 20,000 people homeless, reports said.
- India. Rainfall from the annual monsoon season is down an average of 12 percent across India, as the country enters its fourth drought in just over a decade.
- Some villages in the worst hit drought areas are reportedly on the brink of disaster, reports said.
Related Links
Drought – Recent Links
Global Disasters: Links, Forecasts and Background
Global Warning
Posted in Global Disaster watch, global disasters, global disasters 2012, global drought, global heating, Global Temperature | Tagged: Hurricane ISAAC, India drought, India monsoon, Korean Peninsula, monsoon season, North Korea flooding, Red Flag Warnings, Typhoon BOLAVEN, U.S. wildfires, wildfires | Leave a Comment »
Posted by feww on September 3, 2012
UPDATED September 4, 2012 @ 01:44UTC
Northern Hemisphere Sea Ice Cover Shrinking Rapidly
Arctic sea ice extent shrank to about 3.65 million square kilometers (1.41 million square miles) on September 2, 2012, FIRE-EARTH estimates.
FEWW model shows the Arctic sea ice extent could fall to about 3 million km² (1.15 million square miles) during the 2012 melt season with a probability of 0.5 [P = 54%]

Arctic sea ice extent as of September 1, 2012. Image Source: NSIDC

Arctic sea ice extent, September 1, 2012. FIRE-EARTH estimates the NH ice cover fell below 3.65 million km² (1.41 million square miles) on September 2, 2012. Image Source: NSIDC
Arctic Sea Ice Cover: Denmark’s Center for Ocean and Ice (DMI)

Original caption: Current Sea Ice extent. Total sea ice extent on the northern hemisphere since 2005. The ice extent values are calculated from the ice type data from the Ocean and Sea Ice, Satellite Application Facility (OSISAF), where areas with ice concentration higher than 30% are classified as ice. The total area of sea ice is the sum of First Year Ice (FYI), Multi Year Ice (MYI) and the area of ambiguous ice types, from the OSISAF ice type product. However, the total estimated ice area is underestimated due to unclassified coastal regions where mixed land/sea pixels confuse the applied ice type algorithm. The shown sea ice extent values are therefore recommended be used qualitatively in relation to ice extent values from other years shown in the figure.
Related Links
Global Disasters: Links, Forecasts and Background
GLOBAL WARNING
Posted in Global Disaster watch, global disasters, global heating, Global Temperature | Tagged: Arctic ice extent map, arctic sea ice, Arctic sea ice extent, Arctic sea ice extent map, carrying capacity, Climate Change, Global Disasters, GLOBAL WARNING, NH ice cover, northern hemisphere, Northern Hemisphere Ice Cover, Northern Hemisphere Sea Ice Cover | 4 Comments »
Posted by feww on August 19, 2012
DISASTER CALENDAR SYMBOLIC COUNTDOWN: 1,305 Days Left
[August 19, 2012] Mass die-offs resulting from human impact and the planetary response to the anthropogenic assault could occur by early 2016. SYMBOLIC COUNTDOWN: 1,305 Days Left to the ‘Worst Day’ in Human History…
Global Disasters: Links, Forecasts and Background
Posted in Global Disaster watch, global disasters, global disasters 2012, global drought, global health catastrophe, global heating, Global Temperature, global Temperature Anomalies | Tagged: 2012 disaster calendar, 2012 disasters, Anthropogenic Hell, anthropogenic impact, carrying capacity, collapse, Collapsing Cities, disaster calendar, Disaster Calendar 2012, dynamics of collapse, First Wave of World’s Collapsing Cities, Human Impact on Nature, Looming Collapse, Mass die-offs, Mega Disasters | Leave a Comment »
Posted by feww on January 13, 2011
2010 joint warmest and wettest year on record
Last year tied with 2005 as the warmest year on record for global surface temperature
- The 2010 global land surface temperature were 0.96ºC (1.73º F) above the 20th century average.
- Global ocean surface temperatures in 2010 tied with 2005 as the third warmest at 0.49ºC (0.88ºF ) above the 20th century average.
- 2010 was also the wettest year on record, compared to global average precipitation.
Highlights from NASA Climate Section:
- September Arctic sea ice is now declining at a rate of 11.5 percent per decade, relative to the 1979 to 2000 average. The September 2010 extent was the third lowest in the satellite record.
- As of December 10, 2010, the CO2 concentrations in the atmosphere were 391 ppm.
- Data from NASA’s Grace satellite show that the land ice sheets in both Anarctica and Greenland are losing mass. The continent of Antarctica (left chart) has been losing more than 100 cubic kilometers (24 cubic miles) of ice per year since 2002.
- Sea levels have risen by 53mm since 1993, and by 100 to 200mm since the past century. Sea rise is caused by the thermal expansion of sea water due to climate warming and widespread melting of land ice.
“2010 tied with 2005 as the warmest year of the global surface temperature record, beginning in 1880. This was the 34th consecutive year with global temperatures above the 20th century average. For the contiguous United States alone, the 2010 average annual temperature was above normal, resulting in the 23rd warmest year on record,” NOAA researchers say.
The following is mirrored from NOAA website:
2010 Global Climate Highlights

Global surface temperature anomalies for 2010. Click image to enlarge.
- Combined global land and ocean annual surface temperatures for 2010 tied with 2005 as the warmest such period on record at 1.12 F (0.62 C) above the 20th century average. The range of confidence (to the 95 percent level) associated with the combined surface temperature is +/- 0.13 F (+/- 0.07 C).*
- The global land surface temperatures for 2010 were tied for the second warmest on record at 1.73 F (0.96 C) above the 20th century average. The range of confidence associated with the land surface temperature is +/- 0.20 F (+/- 0.11 C).
- Global ocean surface temperatures for 2010 tied with 2005 as the third warmest on record, at 0.88 F (0.49 C) above the 20th century average. The range of confidence associated with the ocean surface temperature is +/- 0.11 F (+/- 0.06 C).
- In 2010 there was a dramatic shift in the El Niño-Southern Oscillation (ENSO), which influences global temperature and precipitation patterns — when a moderate-to-strong El Niño transitioned to La Niña conditions by July. At the end of November, La Niña was moderate-to-strong.
- According to the Global Historical Climatology Network, 2010 was the wettest year on record, in terms of global average precipitation. As with any year, precipitation patterns were highly variable from region to region.
- The 2010 Pacific hurricane season had seven named storms and three hurricanes, the fewest on record since the mid-1960s when scientists started using satellite observations. By contrast, the Atlantic season was extremely active, with 19 named storms and 12 hurricanes. The year tied for third- and second-most storms and hurricanes on record, respectively.
- The Arctic sea ice extent had a record long growing season, with the annual maximum occurring at the latest date, March 31, since records began in 1979. Despite the shorter-than-normal melting season, the Arctic still reached its third smallest annual sea ice minimum on record behind 2007 and 2008. The Antarctic sea ice extent reached its eighth smallest annual maximum extent in March, while in September, the Antarctic sea ice rapidly expanded to its third largest extent on record.
- A negative Arctic Oscillation (AO) in January and February helped usher in very cold Arctic air to much of the Northern Hemisphere. Record cold and major snowstorms with heavy accumulations occurred across much of eastern North America, Europe and Asia. The February AO index reached -4.266, the largest negative anomaly since records began in 1950.
- From mid-June to mid-August, an unusually strong jet stream shifted northward of western Russia while plunging southward into Pakistan. The jet stream remained locked in place for weeks, bringing an unprecedented two-month heat wave to Russia and contributing to devastating floods in Pakistan at the end of July.

2010 Selected Climate Anomalies and Events Map. Source: NOAA
Top 10 Climate Anomalies in 2010
1. Russian – European – Asian Heat Waves (Summer)
2. 2010 as [near] warmest year on record (calendar year)
3. Pakistani Flooding (Late July – August)
4. El Niño to La Niña Transition (Mid-to-Late Boreal Spring)
5. Negative Arctic Oscillation (Early 2010 )
6. Brazilian Drought (Ongoing)
7-tie. Historically Inactive NE Pacific Hurricane Season (May 15 – Nov 30)
7-tie. Historic N. Hemispheric Snow Retreat (January – June )
9. Minimum Sea Ice Extent (mid-September)
10. China Drought (First Half of 2010)
Contenders for the Top 10 List
- China Floods (Early Aug)
- Large Iceberg Breaks off Petermann Glacier (5-Aug)
- Igor & Julia Simultaneous Category 4 Hurricanes (15-Sep)
- Super Typhoon Megi (Oct 12-24 )
- Coral Reef Bleaching (NH Spring -Summer)
- Cyclone Phet (Early June)
- Bangladesh Driest Monsoon Season since 1994 (Warm Season)
- Hurricane Celia (Jun 19-28)
- Summer Snow in Australia (18-Jan)
- Atlantic Cyclone Xynthia (27-Feb)
- European Cold Snap & Winter Storm (Early Jan)
- South American Cold Snap (July)
- Extreme Winter Weather in Europe** (Most of December)
- Australian Flooding** (25-Dec)
** This event occurred after the top ten voting, but may have warranted top ten placement.

Click image to enlarge. (Source: NOAA)
See Also:
State of the Climate Global Hazards
- Global Hazards/Events, December 2010 ( Drought and wildfires, Flooding, severe storms, severe winter weather.)
- Global Hazards/Events, November 2010 (Hurricane Tomas, A rare early season winter storm across the U.S. states of Iowa, Minnesota, and Wisconsin, Record warm temperatures across western Russia.)
- Global Hazards/Events, October 2010 (Hurricane Tomas, Super Typhoon Megi, Tornado Outbreak in Arizona, etc.)
- Global Hazards/Events, September 2010 (Typhoon Fanapi hits Taiwan & China, 2 tornadoes in New York City, Tropical Storm Earl in Nove Scotia, wildfire in Colorado, etc.)
- Global Hazards/Events, August 2010 (Flooding in China & Pakistan, Tropical Storm Dianmu in South Korea, heat wave/drought in Russia, etc.)
- Global Hazards/Events, July 2010 (Typhoon Conson in Philippines/Vietnam, heat wave in U.S. & Canada, monsoonal rains in Pakistan & India, severe flooding in Northern China, heavy rains in Texas & Mexico, heat wave & wildfires in Western Russia, etc.)
- Global Hazards/Events, June 2010 (Hurricane Alex in Mexico/Belize, Winter Tornado in New South Wales, Tornado in Ohio, Flooding in Arkansas, etc.)
- Global Hazards/Events, May 2010 (Tropical Storm Agatha, Flooding in China and Central Europe, Drought in Hawaii, Tropical Cyclone Laila, etc.)
- Global Hazards/Events, April 2010 (Tornado kills 10 in Mississippi, heatwave in Northeastern U.S., Nor’wester kills 137 in Eastern India/Bangladesh, heavy rainfall causes mudslides/landslides in Peru and Brazil, volcanic eruption in Iceland, etc.)
- Global Hazards/Events, March 2010 (Tropical Cyclone Tomas strikes Fiji, drought in Hawaii, Nor’easter hits U.S. East Coast, major sandstorm in China, tropical storm Hubert in Madagascar, record heavy rainfall in northeastern Australia, etc.)
- Global Hazards/Events, February 2010 (Xynthia attacks Western Europe, Mid-Atlantic/Deep South U.S. snows, Nor’easter hits U.S. East Coast, drought in Southern China, avalanches in Afghanistan, record heat in Western Australia, etc.)
- Global Hazards/Events, January 2010 (Northern Asia extreme cold/snowfall, freezing temperatures in Bangladesh/Nepal, flooding in Egypt/Israel/Kenya, cold damages citrus crop in Florida, wintry precipitation cripples southern U.S., etc.)
NOAA National Climatic Data Center, State of the Climate: Global Hazards for November 2010, published online December 2010, retrieved on January 10, 2011 from http://www.noaa.gov.
Related Links:
Posted in Global Climate Extremes, global precipitation patterns, Global SST Departures, Global Temperature, ocean surface temperature | Tagged: Arctic sea ice extent, El Niño-Southern Oscillation (ENSO), global land surface temperatures, La Niña, warmest year on record | Leave a Comment »
Posted by feww on July 16, 2010
Specter of Global Drought Disasters Looming
Global Food Shortages Would Follow
The Planet Can Survive Higher Temperatures; YOU Can’t!
The first six months of 2010 has been the warmest on record so far. The average global temperatures for the first half of the year were 0.03 degree Fahrenheit higher than the previous record set in 1998, according to the National Climatic Data Center.
The El Nino weather pattern was the major driver for the hot temperatures globally, climate scientists say.
“We had an El Nino episode in the early part of the year that’s now faded but that has contributed to the warmth not only in equatorial Pacific but also contributed to anomalously warm global temperatures as well,” said Jay Lawrimore, chief of climate analysis at the National Climatic Data Center.
Although La Nina could bring in cooler temperatures globally later this year, 2010 could still prove to be the hottest year overall since the records began, overtaking 2005 the previous record holder.
“This year the fact that the El Nino episode has ended and is likely to transition into La Nina, which has a cooling influence on the global average temperature, it’s possible that we will not end up with the warmest year as a whole.” Lawrimore said.
Global View
- The Arctic sea, the ice melted to its thinnest level in June.
- Britain has seen it driest year in 80 years.
- Parts of Middle East are undergoing the most severe drought since records began.
- Northern Thailand is experiencing the worst drought in living memory.
- The U.S.: “It’s going to be pretty warm across eastern Nebraska, Iowa, western portions of Missouri, mid to upper 90s (F),” said Donald Keeney, senior agriculture meteorologist with CROPCAST Ag Services.
- Large temperatures anomalies in most parts of Africa, Canada and tropical oceans have been registered, a report said.
Land Surface Temperatures, Early July 2010

Global map shows temperature anomalies for July 4–11, 2010, compared to temperatures for the same dates from 2000 to 2008. The anomalies are based on land surface temperatures observed by MODIS on NASA’s Terra satellite. Areas with above-average temperatures appear in red and orange, and areas with below-average temperatures appear in shades of blue. Oceans, lakes, and areas with insufficient data (usually because of persistent clouds) appear in gray. Source of Image and caption (edited) NASA E/O. Click image to enlarge. Download large image (3 MB, PNG)
Note from original caption: “Because this image shows temperature anomalies rather than absolute temperatures, not all red areas are warmer than all blue areas. Red-hued northern Canada, for instance, is not warmer than blue-hued northern Mexico. Although deep red tones predominate along the mid-Atlantic coast, absolute temperatures are probably warmer in the barely orange American Southwest. Unusually warm conditions predominate in South America, but the Southern Hemisphere is in winter.”
News Links:
Related Links:
Posted in climate change fallout, El Niño, Global Food Shortages, Global Temperature, La Niña, Land Surface Temperatures | Tagged: Arctic sea, drought and deluge, dynamics of collapse, sea surface temperatures | 5 Comments »
Posted by feww on June 17, 2010
Spring and January-May also post record breaking temps: NOAA
June 2010 could also prove be the warmest on record, by a large margin: Fire Earth
The combined global land and ocean surface temperature was the warmest on record for May, March-May (Northern Hemisphere spring-Southern Hemisphere autumn), and the period January-May, NOAA reported. Worldwide average land surface temperature for May and March-May was the warmest on record while the global ocean surface temperatures for both May and March-May were second warmest on record, behind 1998.
Global Temp Highlights: May 2010
- The combined global land and ocean surface temperature for May was 0.69°C (1.24°F) above the 20th century average of 14.8°C (58.6°F).
- Land surface temperature was the warmest on record, 1.04°C (1.87°F) higher than 20th century average of 11.1°C (52.0°F).
- Ocean temperature was the second warmest on record (after 1998) at 16.3°C (61.3°F), 0.99°F (0.55°C) above the 20th century average.
- The warmest temperature anomalies occurred in eastern North America, eastern Brazil, Eastern Europe, southern Asia, eastern Russia, and equatorial Africa.
- The Chinese province of Yunnan had its warmest May since 1951.
- Many locations in Ontario, Canada had their warmest May on record.
- Anomalously cool conditions were present across western North America, northern Argentina, interior Asia, and Western Europe. Germany had its coolest May since 1991 and its 12th coolest May on record.

Temperature anomalies May 2010. Source NOAA. Click image to enlarge.
Global Highlights – March-May 2010
- The combined global land and ocean surface average temperature for the March-May period was 14.4°C (58.0°F), the warmest such period on record, and 1.31°F (0.73°C) above the 20th century average of 56.7°F (13.7°C).
- Global land surface temperature for March-May was the warmest on record at 1.22°C (2.20°F) above the 20th century average of 8.1°C (46.4 °F).
- Global ocean surface temperature was the second warmest March-May on record (behind 1998) at 0.55°C (0.99°F) above the 20th century average of 16.1°C (61.0°F).
- The temperatures were very warm across eastern and northern North America, northern Africa, Eastern Europe, southern Asia, and parts of Australia.
- Tasmania tied its warmest March-May period on record.
- The Northeastern U.S. also had its warmest March-May period on record.
- Conversely, cool temperatures enveloped the western U.S. and eastern Asia.
- Western Europe was particularly dry for its spring season.
- The United Kingdom experienced its driest spring in 26 years, and the 12th driest since 1910, when UK records began.

Temperature anomalies March-May 2010. Source NOAA. Click image to enlarge.
Other Highlights
- Arctic sea ice covered an average of 5.06 million square miles (13.1 million square kilometers) in May 2010, which was 3.7 percent below the 1979-2000 average extent and the ninth-smallest May footprint since records began in 1979.
- Arctic sea ice melted 50 percent faster than the average May melting rate, the National Snow & Ice Data Center reported.
- Antarctic sea ice extent in May was 7.3 percent above the 1979-2000 average, resulting in the fourth largest May extent on record.
- Northern Hemisphere snow cover extent during May 2010 was a record low at 4.3 million square kilometers below the long-term average. North America and Eurasia both had record-low snow extents for the month.
- Northern Hemisphere March-May snow cover extent was fourth smallest on record.
- The North American (including Greenland) snow cover extent for spring (March-May) 2010 was the smallest on record.
See also: May 2010 Global State of the Climate – Supplemental Figures and Information
Related Links:
Posted in Global SST anomalies, Global SST Departures, Global Temperature, global water crisis | Tagged: Global Temperature, Global temperature MAY 2010, May Global Temperature, Temperature anomalies May 2010, Yunnan province temperature | 1 Comment »
Posted by feww on January 23, 2010
Overall 2009 Annual Temperatures Joint Fifth-Warmest
The 2009 December global ocean temperature was the second warmest on record, The US National Oceanic and Atmospheric Administration (NOAA).

The map shows temperature changes for the last decade — January 2000 to December 2009 — relative to the 1951-1980 mean. Warmer areas are in red, cooler areas in blue. The largest temperature increases occurred in the Arctic and a portion of Antarctica. (Image credit: NASA). Click image to enlarge.
The overall 2009 annual temperatures was a joint fifth-warmest, their records show.
“Based on records going back to 1880, the monthly NCDC analysis is part of the suite of climate services NOAA provides. Scientists also reported the combined global land and ocean surface temperature was the eighth warmest on record for December,” according to scientists at NOAA’s National Climatic Data Center in Asheville, N.C.
- Global temperatures in 2009 tied with 2006 as the fifth-warmest on record.
- The planet’s land surface temperatures in 2009 tied with 2003 as seventh-warmest.
- The overall annual ocean surface temperatures were fourth-warmest, joint position with 2002 and 2004.
Highlights for December 2009
The global ocean temperature was the second warmest on record, trailing 1997.
- The temp anomaly was about one degree F (0.97ºF) above the 20th century average of 60.4ºF.
- Global land and ocean surface temperatures combined were the eighth warmest since 1880, at 0.88ºF above the 20th century average of 54.0ºF.
- The global land surface temperature was 0.63ºF above the 20th century average of 38.7ºF—the coolest December anomaly since 2002.
Global Temperature Highlights for 2009
- In 2009, the annual global combined land and ocean surface temperature was 1.01ºF above the 20th century average of 58.0ºF sharing joint fifth-warmest position with 2006.
The average decadal temperature for the 2000-09 decade was 57.9ºF, the warmest on record topping the 1990-99 average by 0.02ºF, NCDC scientists said.
Other Heat Highlights
- December Arctic sea ice cover was an average of 12.4 million km² (4.8 million square miles), falling 6.6 percent below the 1979-2000 average extent and the fourth lowest December extent since 1979, when records began.
- “Antarctic sea ice extent in December was 2.1 percent above the 1979-2000 average, resulting in the 14th largest December extent on record. December Arctic sea ice extent has decreased by 3.3 percent per decade since 1979, while December Antarctic sea ice extent has increased by 0.6 percent per decade over the same period.”
- Snow cover in Northern Hemisphere during December 2009 was the second largest on record, chasing 1985. “North American snow cover for December 2009 was the largest extent since satellite records began in 1967.”
Related Links:
Posted in combined land and ocean surface temp, Global Temperature, global temperatures, land and ocean temp, ocean surface temperatures | Tagged: Antarctic sea ice exten, Arctic sea ice cover, December Ocean Temperature, global land surface temp, National Climatic Data Center, ocean surface temp, Ocean Temperature | 2 Comments »


