Archive for the ‘El Niño’ Category
Posted by feww on June 8, 2012
DISASTER CALENDAR SYMBOLIC COUNTDOWN: 1,377 Days Left
[June 8, 2012] Mass die-offs resulting from human impact and the planetary response to the anthropogenic assault could occur by early 2016. SYMBOLIC COUNTDOWN: 1,377 Days Left to the ‘Worst Day’ in Human History…
Global Disasters: Links, Forecasts and Background
Posted in DWV virus, El Niño, El Niño conditions, Global Disaster watch, global disasters, global disasters 2012 | Tagged: 2012 disaster calendar, antibiotic-resistant bacteria, antibiotic-resistant superbug, Apiculture, Bee, Bee-killing virus, collapse, colony collapse disorder, disaster calendar, energy dinosaurs, global climate change, Global Climate Extremes, global collapse, Global Disaster Forecast, human-enhanced natural disasters, Mass die-offs, Mega Disasters, Varroa mite | 1 Comment »
Posted by feww on September 19, 2010
La Niña Conditions Continue to Strengthen Across the Equatorial Pacific Ocean.

Above map shows a 10-day average of sea-surface height and was acquired by the Ocean Surface Topography Mission/Jason-2 satellite on September 6, 2010. Higher water surface areas signifying warmer temperatures are shades of red-brown, and areas of lower water surface (cooler) are blue. White areas are normal condition. “The El Niño weakens the westward trade winds that normally blow over the eastern tropical Pacific Ocean. Those winds keep eastern Pacific waters cool and concentrate warm waters in the western Pacific. A weakening of trade winds enables warm waters to gradually spread eastward, heating up the central Pacific. La Niña typically follows El Niño, and causes essentially the opposite conditions. La Niña strengthens the trade winds, spreading cool water from the South American coast to the central Pacific. This see-saw pattern of El Niño and La Niña can drive large-scale weather changes, especially in the tropics.” Full caption here… Source: NASA E/O. Click image to enlarge. Download large image (1 MB, PNG).
Sea Surface Temperatures

50 KM Global Analysis – updated weekly.
Current Conditions

Source: NWS/CPC/NOAA
Current SST Anomalies

SST Anomalies During El Niño

Above image shows SST Anomalies during the 2009 El Niño episode, saved on July 27, 2009 and included for comparison.
Related Links:
Posted in El Niño, El Niño conditions, El Niño episode, El Niño impact, La Niña, La Niña episode | Tagged: negative ONI, SST anomalies, Trade winds, tropical Pacific Ocean | Leave a Comment »
Posted by feww on July 16, 2010
Specter of Global Drought Disasters Looming
Global Food Shortages Would Follow
The Planet Can Survive Higher Temperatures; YOU Can’t!
The first six months of 2010 has been the warmest on record so far. The average global temperatures for the first half of the year were 0.03 degree Fahrenheit higher than the previous record set in 1998, according to the National Climatic Data Center.
The El Nino weather pattern was the major driver for the hot temperatures globally, climate scientists say.
“We had an El Nino episode in the early part of the year that’s now faded but that has contributed to the warmth not only in equatorial Pacific but also contributed to anomalously warm global temperatures as well,” said Jay Lawrimore, chief of climate analysis at the National Climatic Data Center.
Although La Nina could bring in cooler temperatures globally later this year, 2010 could still prove to be the hottest year overall since the records began, overtaking 2005 the previous record holder.
“This year the fact that the El Nino episode has ended and is likely to transition into La Nina, which has a cooling influence on the global average temperature, it’s possible that we will not end up with the warmest year as a whole.” Lawrimore said.
Global View
- The Arctic sea, the ice melted to its thinnest level in June.
- Britain has seen it driest year in 80 years.
- Parts of Middle East are undergoing the most severe drought since records began.
- Northern Thailand is experiencing the worst drought in living memory.
- The U.S.: “It’s going to be pretty warm across eastern Nebraska, Iowa, western portions of Missouri, mid to upper 90s (F),” said Donald Keeney, senior agriculture meteorologist with CROPCAST Ag Services.
- Large temperatures anomalies in most parts of Africa, Canada and tropical oceans have been registered, a report said.
Land Surface Temperatures, Early July 2010

Global map shows temperature anomalies for July 4–11, 2010, compared to temperatures for the same dates from 2000 to 2008. The anomalies are based on land surface temperatures observed by MODIS on NASA’s Terra satellite. Areas with above-average temperatures appear in red and orange, and areas with below-average temperatures appear in shades of blue. Oceans, lakes, and areas with insufficient data (usually because of persistent clouds) appear in gray. Source of Image and caption (edited) NASA E/O. Click image to enlarge. Download large image (3 MB, PNG)
Note from original caption: “Because this image shows temperature anomalies rather than absolute temperatures, not all red areas are warmer than all blue areas. Red-hued northern Canada, for instance, is not warmer than blue-hued northern Mexico. Although deep red tones predominate along the mid-Atlantic coast, absolute temperatures are probably warmer in the barely orange American Southwest. Unusually warm conditions predominate in South America, but the Southern Hemisphere is in winter.”
News Links:
Related Links:
Posted in climate change fallout, El Niño, Global Food Shortages, Global Temperature, La Niña, Land Surface Temperatures | Tagged: Arctic sea, drought and deluge, dynamics of collapse, sea surface temperatures | 5 Comments »
Posted by feww on April 21, 2010
ENSO Cycle: Recent Evolution, Current Status and Predictions
El Niño Weekly UPDATE prepared by Climate Prediction Center / NCEP – 19 April 2010
The latest weekly SST departures are:
- Niño 4 ~ 0.8ºC
- Niño 3.4 ~ 0.8ºC
- Niño 3 ~ 0.8ºC
- Niño 1+2 ~ 1.1ºC

El Niño Map. [SOURCE: NOAA/ Climate Prediction Center / NCEP]
Summary
- El Niño is present across the equatorial Pacific Ocean.
- Sea surface temperatures (SST) are more than 1.0ºC above-average across muchof the central and eastern equatorial Pacific.
- Based on current observations and dynamical model forecasts, El Niño is expected to continue through the Northern Hemisphere spring 2010 and transition to ENSO-neutral conditions by Northern Hemisphere summer 2010.
Related Links:
El Niño Updates – Previous 5 Issues:
- El Niño [Main Page, Links to Weekly Updates Archive]
–
Serial No 1,601. Starting April 2010, each entry on this blog has a unique serial number. If any of the numbers are missing, it may mean that the corresponding entry has been blocked by Google/the authorities in your country. Please drop us a line if you detect any anomaly/missing number(s).
Posted in Climate Prediction, El Niño, El Niño 2010, El Niño report, El Niño today | Tagged: El Niño April, El Niño drought, El Niño impact, El Niño latest, El Niño update, ENSO-neutral, Equatorial Pacific, Oceanic Niño Index, SST anomalies, Tropical Pacific | Leave a Comment »
Posted by feww on April 6, 2010
Serial No 1,541. If any posts are blocked in your country, please drop us a line.
ENSO Cycle: Recent Evolution, Current Status and Predictions
El Niño Weekly UPDATE prepared by Climate Prediction Center / NCEP – 5 April 2010
The latest weekly SST departures are:
- Niño 4 ~ 0.9ºC
- Niño 3.4 ~ 1.0ºC
- Niño 3 ~ 0.9ºC
- Niño 1+2 ~0.1ºC
El Niño Map. [SOURCE: NOAA/ Climate Prediction Center / NCEP]
SST Departures (ºC) in the Tropical Pacific During the Last 4 Weeks
During the last 4-weeks, equatorial SSTs were more than 1.0°C above average between 165°E and 120°W and near the western S. American coast.
Global SST Departures (ºC)
During the last four weeks, equatorial SSTs were above-average across the Pacific, Indian, and Atlantic Oceans.
Weekly SST Departures (ºC) for the Last Four Weeks
- During the last four weeks, positive SST anomalies have persisted across the central, east-central, and far eastern Pacific.
- During the last 30 days, equatorial SST anomalies are nearly unchanged across much of the Pacific.
Global SST Departures (ºC)
During the last four weeks, equatorial SSTs were above-average across the Pacific, Indian, and Atlantic Oceans.
Central & Eastern Pacific Upper-Ocean (0-300 m) Weekly Heat Content Anomalies
Since April 2009, the upper-ocean heat content has been above average across the eastern half of the equatorial Pacific Ocean. Sharp increases in heat content during June and October 2009 coincide with the development and subsequent strengthening of El Niño, respectively. Since late February 2010, the heat content anomalies have decreased.
Sub-Surface Temperature Departures (ºC) in the Equatorial Pacific
- Since mid-February 2010, positive subsurface temperature anomalies increased in association with the downwelling phase of an oceanic Kelvin wave
- Recently, the Kelvin wave has increased temperatures in the eastern equatorial Pacific Ocean. The upwelling phase of the Kelvin wave has contributed to below-average temperatures at depth in the central Pacific.

Click image to enlarge.
Atmospheric Circulation over the North Pacific & North America During the Last 60 Days
During February, strong mid-latitude westerlies(East Asian and Atlantic jets) were accompanied by troughs overthe eastern North Pacific and near the eastern U.S. The anomalous troughs were associated with below-average temperatures over much of the central and eastern United States. At higher latitudes, strong ridging was associated with above-average temperatures across most of Canada. Since early March, the flow across the N. Pacific and Atlantic has weakened. This pattern has contributed to below-average temperatures across the southern U.S. while ridging and above-average temperatures were observed over Canada and the northeastern U.S.

Pacific Niño 3.4 SST Outlook
- A majority of the models indicate that the Niño-3.4 temperature departures will gradually decrease at least into the summer.
- The models are split with the majority indicating ENSO-neutral conditions by May-July 2010, which persistinto the fall. Several models also suggest the potential of continued El Niño conditions or the development of La Niña conditions during the late summer or fall.
SST Outlook: NCEP CFS Forecast Issued 4 April 2010
Summary
El Niño is present across the equatorial Pacific Ocean.
Sea surface temperatures (SST) are more than 1.0ºCabove-average across much of the central and eastern equatorial Pacific.
Based on current observations and dynamical model forecasts, El Niño is expected to continue at least through the Northern Hemisphere spring 2010.
Unless otherwise stated, information and images on this page are sourced from Climate Prediction Center/NCEP/NOAA. Edited by FEWW
Related Links:
El Niño Updates – Last 4 Weeks:
- El Niño [Main Page, Links to Weekly Updates Archive]
Posted in Climate Prediction, El Niño, El Niño 2010, El Niño report, El Niño today, El Niño update | Tagged: El Niño drought, El Niño impact, El Niño latest, El Niño report, Oceanic Niño Index, SST anomalies, Tropical Pacific SST | Leave a Comment »
Posted by feww on March 24, 2010
ENSO Cycle: Recent Evolution, Current Status and Predictions
El Niño Weekly UPDATE prepared by Climate Prediction Center / NCEP – 22 March 2010
The latest weekly SST departures are:
- Niño 4 ~ 1.1ºC
- Niño 3.4 ~ 1.2ºC
- Niño 3 ~ 0.7ºC
- Niño 1+2 ~ (– 0.1ºC)
El Niño Map. [SOURCE: NOAA/ Climate Prediction Center / NCEP]
Summary:
- El Niño is present across the equatorial Pacific Ocean.
- Sea surface temperatures (SST) are more than 1.0ºCabove-average across much of the central and eastern equatorial Pacific.
- Based on current observations and dynamical model forecasts, El Niño is expected to continue at least through the Northern Hemisphere spring 2010.
Related Links:
El Niño Updates – Last 5 Weeks:
- El Niño [Main Page, Links to Weekly Updates Archive]
Posted in Climate Prediction, El Niño, ENSO, Oceanic Niño Index, Tropical Pacific SST | Tagged: El Niño rain, El Niño update, El Niño update 2010, El Niño update march | 2 Comments »
Posted by feww on March 9, 2010
Fire-Earth Forecast: More extremes of weather could affect western, northwestern and northern regions of South America throughout the spring 2010, possibly extending into the summer.
ENSO Cycle: Recent Evolution, Current Status and Predictions
El Niño Weekly UPDATE prepared by Climate Prediction Center / NCEP – 8 March 2010
The latest weekly SST departures are:
- Niño 4 ~ 1.1ºC
- Niño 3.4 ~ 1.1ºC
- Niño 3 ~ 0.7ºC
- Niño 1+2 ~ 0.1ºC
El Niño Map. [SOURCE: NOAA/ Climate Prediction Center / NCEP]
SST Departures (ºC) in the Tropical Pacific During the Last 4 Weeks
During the last 4-weeks, equatorial SSTs were more than 1.0°C above average between 170°E and 125°W and near the western S. American coast.
Global SST Departures
During the last four weeks, equatorial SSTs were above-average across the central and eastern Pacific, Indian, and Atlantic Oceans.
Weekly SST Departures for the Last Four Weeks

Source: Climate Prediction Center/NCEP
Summary
- El Niño is present across the equatorial Pacific Ocean.
- Sea surface temperatures (SST) are more than 1.0ºCabove-average across much of the central and eastern equatorial Pacific.
- Based on current observations and dynamical model forecasts, El Niño is expected to continue at least through the Northern Hemisphere spring 2010.
Unless otherwise stated, information and images on this page are sourced from Climate Prediction Center/NCEP/NOAA. Edited by FEWW
Related Links:
El Niño Updates – Last 4 Weeks:
- El Niño [Main Page, Links to Weekly Updates Archive]
Posted in Climate Prediction, El Niño, El Niño 2010, El Niño report, El Niño today, ENSO | Tagged: El Niño conditions, El Niño drought, El Niño impact, El Niño latest news, El Niño rain, El Niño update, El Niño update 2010, El Niño update MARCH 2010, La Niña episode, Oceanic Niño Index, SST anomalies, Tropical Pacific SST | 5 Comments »
Posted by feww on March 2, 2010
ENSO Cycle: Recent Evolution, Current Status and Predictions
El Niño Weekly UPDATE prepared by Climate Prediction Center / NCEP – 1 March 2010
The latest weekly SST departures are:
- Niño 4 ~ 1.2ºC
- Niño 3.4 ~ 1.2ºC
- Niño 3 ~ 0.9ºC
- Niño 1+2 ~ 0.4ºC
El Niño Map. [SOURCE: NOAA/ Climate Prediction Center / NCEP]
SST Departures (ºC) in the Tropical Pacific During the Last 4 Weeks
During the last 4-weeks, equatorial SSTs were more than 1.0°C above average between 175°E and 125°W and near the western S. American coast.
Global SST Departures (ºC) – Click images to enlarge

During the last four weeks, equatorial SSTs were above-average across the central and eastern Pacific, Indian, and Atlantic Oceans.

Central & Eastern Pacific Upper-Ocean (0-300 m) Weekly Heat Content Anomalies
Since April 2009, the upper-ocean heat content has been above average across the eastern half of the equatorial Pacific Ocean. Sharp increases in heat content during June and October coincide with the development and subsequent strengthening of El Niño, respectively. Recently, heat content anomalies have increased again in association with an oceanic Kelvin wave.


Atmospheric Circulation over the North Pacific & North America During the Last 60 Days

From late December to early January, strong mid-latitude westerlies(East Asian and Atlantic jets) were accompanied by troughs over the North Pacific and the eastern U.S. The troughs contributed to below-average temperatures across portions of the U.S. At higher latitudes, strong ridging led to above-average temperatures across parts of Canada. During mid to late January, the East Asian jet extended farther east and a strong trough became established over the eastern Pacific. Over N. America, strong ridging contributed to above-average temperatures over much of N. America. During February, troughing and below-average temperatures became reestablished over the middle latitudes, along with ridging and above-average temperatures over higher latitudes.
Pacific Niño 3.4 SST Outlook
- A majority of the models indicate that the Niño-3.4 temperature departures will gradually decrease at least into the summer.
- The models are split with the majority indicating ENSO-neutral conditions by May-July 2010 and persisting into the Fall. Several models also suggest the potential of continued El Niño conditions or the development of La Niña conditions during the Fall.

Figure provided by the International Research Institute (IRI) for Climate and Society (updated 16 Feb 2010).
Summary
- El Niño is present across the equatorial Pacific Ocean.
- Sea surface temperatures (SST) are more than 1.0ºCabove-average across much of the central and eastern equatorial Pacific.
- Based on current observations and dynamical model forecasts, El Niño is expected to continue at least into the Northern Hemisphere spring 2010.
Unless otherwise stated, information and images on this page are sourced from Climate Prediction Center/NCEP/NOAA. Edited by FEWW
Related Links:
El Niño Updates – Last 4 Weeks:
- El Niño [Main Page, Links to Weekly Updates Archive]
Posted in Climate Prediction, El Niño, El Niño 2010, El Niño report | Tagged: El Niño conditions, El Niño drought, El Niño impact, El Niño latest news, El Niño rain, El Niño update 2010, El Niño update MARCH 2010, ENSO, Oceanic Niño Index, SST anomalies, Tropical Pacific SST | 2 Comments »
Posted by feww on February 25, 2010
ENSO Cycle: Recent Evolution, Current Status and Predictions
El Niño Weekly UPDATE prepared by Climate Prediction Center / NCEP – 22 February 2010
The latest weekly SST departures are:
- Niño 4 ~ 1.1ºC
- Niño 3.4 ~ 1.2ºC
- Niño 3 ~ 0.8ºC
- Niño 1+2 ~ 0.4ºC
El Niño Map. [SOURCE: NOAA/ Climate Prediction Center / NCEP]
SST Departures (ºC) in the Tropical Pacific During the Last 4 Weeks
During the last 4-weeks, equatorial SSTs were more than 1.0°C above average between 175°E and 125°W.
Global SST Departures (ºC)
During the last four weeks, equatorial SSTs were above-average across the central and eastern Pacific, Indian, and Atlantic Oceans.
Weekly SST Departures (oC) for the Last Four Weeks
- Weeks•During the last four weeks, positive SST anomalies have extended from 170°E eastward to the South American coast.
- During the last 30 days, equatorial SST anomalies have decreased across the central Pacific and increased in the extreme eastern Pacific
Sub-Surface Temperature Departures (ºC) in the Equatorial Pacific
- In mid January 2010, positive subsurface temperature anomalies increased in the eastern equatorial Pacific in association with the downwellingphase of an oceanic Kelvin wave.
- The most recent period (below) indicates another downwellingphase of an oceanic Kelvin wave is increasing temperatures in the east-central equatorial Pacific Ocean.

Atmospheric Circulation over the North Pacific & North America During the Last 60 Days
From mid-December to early January, strong mid-latitude westerlies(East Asian and Atlantic jets) were accompanied by troughs over the North Pacific and the eastern U.S. The troughs contributed to below-average temperatures across portions of the U.S. At higher latitudes, strong ridging led to above-average temperatures across parts of Canada. Since mid January,the East Asian jet extended farther east and a trough became established over the eastern Pacific. Over N. America, strong ridging over Canada contributed to above-average temperatures across Canada and the northwestern U.S. During early February, troughing and below-average temperatures became reestablished over the eastern and central United States.

Pacific Niño 3.4 SST Outlook
- A majority of the models indicate that the Niño-3.4 temperature departures will gradually decrease at least into the summer.
- The models are split with the majority indicating ENSO-neutral conditions by May-July 2010 and persisting into the Fall. Several models also suggest the potential of continued El Niño conditions or the development of La Niña conditions during the Fall.
Summary
- El Niño is present across the equatorial Pacific Ocean.
- Sea surface temperatures (SST) are more than 1.0ºC above-average across much of the central and east-central equatorial Pacific.
- Based on current observations and dynamical model forecasts, El Niño is expected to continue at least into the Northern Hemisphere spring 2010.
Related Links:
El Niño Updates – Last 4 Weeks:
- El Niño [Main Page, Links to Weekly Updates Archive]
Posted in Climate Prediction, El Niño, El Niño 2010, El Niño report, El Niño update | Tagged: El Niño conditions, El Niño drought, El Niño impact, El Niño latest news, El Niño rain, El Niño update 2010, El Niño update Feb 25, ENSO, Oceanic Niño Index, SST anomalies, Tropical Pacific SST | 3 Comments »
Posted by feww on February 16, 2010
ENSO Cycle: Recent Evolution, Current Status and Predictions
El Niño Weekly UPDATE prepared by Climate Prediction Center / NCEP – 15 February 2010
The latest weekly SST departures are:
- Niño 4 ~ 1.0ºC
- Niño 3.4 ~ 1.2ºC
- Niño 3 ~ 0.7ºC
- Niño 1+2 ~ (-0.1ºC)
El Niño Map. [SOURCE: NOAA/ Climate Prediction Center / NCEP]
SST Departures (ºC) in the Tropical Pacific During the Last 4 Weeks
Equatorial SSTs were more than 1.0°C above average between 175°E and 125°W.

Click image to enlarge.
Weekly SST Departures (ºC) for the Last Four Weeks
- During the last four weeks, positive SST anomalies have weakened across the eastern half of the equatorial Pacific Ocean.
- During the last 30 days, equatorial SST anomalies have decreased across much of the central and eastern Pacific.
Sub-Surface Temperature Departures (ºC) in the Equatorial Pacific

Click image to enlarge.
- In early January 2010, positive subsurface temperature anomalies increased in the central equatorial Pacific in association with the downwelling phase of an oceanic Kelvin wave.
- The most recent period (below) indicates a broad area of above-average subsurface temperatures across the eastern half of the equatorial Pacific Ocean.

Click image to enlarge.
Atmospheric Circulation over the North Pacific & North America During the Last 60 Days

Click image to enlarge. From mid-December to mid-January, strong mid-latitude westerlies (East Asian and Atlantic jets) were accompanied by troughs over the North Pacific and North America. The troughs contributed to below-average temperatures across portions of the U.S. and Canada. At higher latitudes, strong ridging led to above-average temperatures across Alaska and northern Canada. During late January, the East Asian jet extended farther east and a trough became established over the eastern Pacific. Over much of N. America, strong ridging over Canada contributed to above-average temperatures across Canada and portions of the U.S. During early February, troughing and below-average temperatures became reestablished over the United States.

Click image to enlarge.
Intraseasonal Variability
- Intraseasonal variability in the atmosphere (wind and pressure), which is often related to the Madden-Julian Oscillation (MJO), can significantly impact surface and subsurface conditions across the Pacific Ocean.
- Related to this activity
- significant weakening of the low-level easterly winds usually initiates an eastward-propagating oceanic Kelvin wave.
- Several Kelvin waves have occurred during the last year (see next slide).

Click image to enlarge.

Click image to enlarge.

Click image to enlarge.
Pacific Niño 3.4 SST Outlook
- A majority of the models indicate that the current El Niño episode is near or at its peak (e.g. December-January-February).
- After peaking, nearly all models indicate Niño-3.4 temperature departures will gradually decrease, with about half of the models indicating that El Niño will continue into April-May-June 2010.
SST Outlook: NCEP CFS Forecast Issued 31 January 2010
The NCEP CFS predicts El Niño will last through the Northern Hemisphere summer 2010.
Summary
- El Niño is present across the equatorial Pacific Ocean.
- Sea surface temperatures (SST) are more than 1.0ºCabove-average across much of the central and east-central equatorial Pacific.
- Based on current observations and dynamical model forecasts, El Niño is expected to continue at least into the Northern Hemisphere spring 2010.
Unless otherwise stated, information and images on this page are sourced from Climate Prediction Center/NCEP/NOAA. Edited by FEWW
Related Links:
El Niño Updates – Last 4 Weeks:
- El Niño [Main Page, Links to Weekly Updates Archive]
Posted in Climate Prediction, El Niño, El Niño 2010, El Niño report, El Niño update | Tagged: El Niño conditions, El Niño drought, El Niño impact, El Niño latest news, El Niño rain, El Niño update 2010, El Niño update Feb, ENSO, Oceanic Niño Index, SST anomalies, Tropical Pacific SST | 3 Comments »
Posted by feww on February 10, 2010
ENSO Cycle: Recent Evolution, Current Status and Predictions
El Niño Weekly UPDATE prepared by Climate Prediction Center / NCEP – 8 February 2010
The latest weekly SST departures are:
- Niño 4 ~ 1.1ºC
- Niño 3.4 ~ 1.2ºC
- Niño 3 ~ 0.6ºC
- Niño 1+2 ~ 0.0ºC
El Niño Map. [SOURCE: NOAA/ Climate Prediction Center / NCEP]
Global SST Departures (°C)
During the last four weeks, equatorial SSTs were above-average across the central and eastern Pacific, Indian, and Atlantic Oceans.
Weekly SST Departures (ºC) for the Last Four Weeks
- During the last four weeks, positive SST anomalies have weakened across the eastern half of the equatorial Pacific Ocean.
- During the last 30 days, equatorial SST anomalies have decreased across the east-central and eastern Pacific.
Click images to enlarge


From December to early January, strong mid-latitude westerlies (East Asian and Atlantic jets) were accompanied by troughs over the North Pacific and North America. The troughs contributed to below-average temperatures across portions of the U.S. and Canada. At higher latitudes, strong ridging led to above-average temperatures across Alaska and northern Canada. Since mid January, the East Asian jet has extended farther east and a trough has become established over the eastern Pacific. Overmuch of N. America, strong ridging over Canada has contributed to above-average temperatures across Canada and portions of the contiguous U.S. This recent pattern is typical of El Niño.
SST Outlook: NCEP CFS Forecast Issued 31 January 2010
The NCEP CFS predicts El Niño will last through the Northern Hemisphere summer 2010.
Summary
- El Niño is present across the equatorial Pacific Ocean.
- Sea surface temperatures (SST) are 1.0ºC-2.5ºC above-average across much of the central and east-central equatorial Pacific.
- Based on current observations and dynamical model forecasts, El Niño is expected to continue at least into the Northern Hemisphere spring 2010.
Unless otherwise stated, information and images on this page are sourced from Climate Prediction Center/NCEP/NOAA. Edited by FEWW
Related Links:
El Niño Updates – Last 4 Weeks:
- El Niño [Main Page, Links to Weekly Updates Archive]
.
Posted in Climate Prediction, El Niño, El Niño 2010, El Niño conditions, El Niño impact, El Niño latest news, El Niño update, El Niño update 2010, El Niño weekly report | Tagged: El Niño drought, El Niño impact, El Niño rain, El Niño update Feb, ENSO, Oceanic Niño Index, SST anomalies, Tropical Pacific SST | 5 Comments »
Posted by feww on February 3, 2010
ENSO Cycle: Recent Evolution, Current Status and Predictions
El Niño Weekly UPDATE prepared by Climate Prediction Center / NCEP – 1 February 2010
The latest weekly SST departures are:
- Niño 4 ~ 1.3ºC
- Niño 3.4 ~ 1.2ºC
- Niño 3 ~ 0.7ºC
- Niño 1+2 ~ 0.4ºC
El Niño Map. [SOURCE: NOAA/ Climate Prediction Center / NCEP]
Weekly SST Departures (ºC) for the Last Four Weeks
- During the last four weeks, positive SST anomalies have weakened across the eastern half of the equatorial Pacific Ocean.
- During the last 30 days, equatorial SST anomalies have decreased across the east-central and eastern Pacific.
SST Departures (°C) in the Tropical Pacific During the Last 4 Weeks
During the last 4-weeks, equatorial SSTs were more than 2.0°C above average between 170°W and 150°W.
Click on the images to enlarge


Global SST Departures (°C)
During the last four weeks, equatorial SSTs were above-average across the Pacific, Indian, and Atlantic Oceans.
Weekly SST Departures (°C) for the Last Four Weeks
- During the last four weeks, positive SST anomalies have weakened across the eastern half of the equatorial Pacific Ocean.
- During the last 30 days, equatorial SST anomalies have decreased across the east-central and eastern Pacific.

Central & Eastern Pacific Upper-Ocean (0-300 m) Weekly Heat Content Anomalies
Since April 2009, the upper-ocean heat content has been above average across the eastern half of the equatorial Pacific Ocean. Sharp increases in heat content during June and October coincide with the development and subsequent strengthening of El Niño, respectively.

SST Outlook: NCEP CFS Forecast Issued 31 January 2010
The CFS ensemble mean predicts El Niño will last through the Northern Hemisphere summer 2010.
Unless otherwise stated, information and images on this page are sourced from Climate Prediction Center/NCEP/NOAA. Edited by FEWW
Summary
- El Niño is present across the equatorial Pacific Ocean.
- Sea surface temperatures (SST) are 1.0ºC-2.5ºC above-average across much of the central and east-central equatorial Pacific.
- Based on current observations and dynamical model forecasts, El Niño is expected to continue at least into the Northern Hemisphere spring 2010.
Related Links:
El Niño Updates:
- El Niño [Main Page, Links to Weekly Updates Archive]
Posted in Climate Prediction, El Niño, El Niño 2010, El Niño update 2010, ENSO | Tagged: El Niño 2010, El Niño drought, El Niño impact, El Niño rain, Oceanic Niño Index, SST anomalies, Tropical Pacific SST | 6 Comments »
Posted by feww on January 30, 2010
Bolivia’s Evo Morales declares a national emergency
The Bolivian President, Evo Morales, declared a national emergency Friday amid weeks of heavy rains and flooding that have killed at least 10 people and affected some 24,000 families nationwide.

Political map of Bolivia. Click image to enlarge.
“We are declaring a national emergency across Bolivia in response to the effects of flooding, hailstorms, landslides and rivers breaking their banks,” according to a decree issued by the President and his cabinet.
The worst hit regions include Santa Cruz region, Cochabamba, Chuquisaca and Beni, news agencies reported.
The heavy rains have swept away livestock and submerged thousands of hectares of cropland and grassland in flood water.
A large landslide obliterated at least 72 homes on the outskirts of the capital La Paz on Thursday.
The government is concerned however that the Beni region could top the list of their disaster-stricken regions because Bolivia’s major rivers converge there.

Photo: Rio Beni (2008). Credit: Pattrön. For licensing details click here. Beni (capital: Trinidad), a northeastern department of Bolivia, is located in the lowlands region of the Bolivia and is the second largest department in the country (after Santa Cruz), covering about 213,600 square kilometers.
“Beni’s capital Trinidad, home to some 120,000 people, was on aler2t Friday as the water level rose within inches of breaching nearby dams.” AFP reported.
Heavy rains are expected to continue, Bolivia’s National Meteorology and Hydrology Service reported.
Although Bolivia’s rainy season falls in January and February, the weather forecasters believe both the climate change and El Niño have intensified the severity of the rain events.
Related Links:
Posted in Beni region, Chuquisaca, El Niño, flood in Bolivia, flooding, La Paz | Tagged: Bolivia, Bolivian flood, Cochabamba, Evo Morales, extreme rain, flood, Landslide, national emergency, Santa Cruz region | 1 Comment »
Posted by feww on January 23, 2010
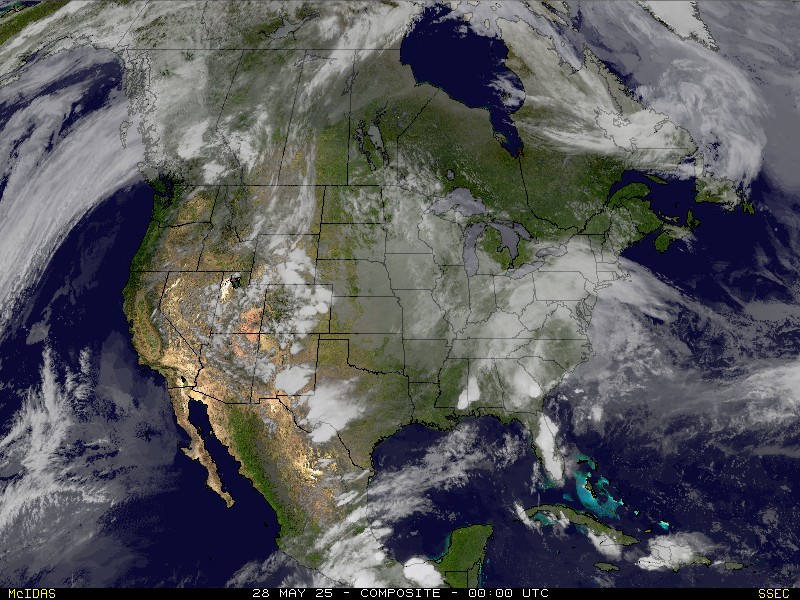
California Buffeted by Severe Storms

Several days of severe storms brought high winds and heavy rains to California, causing flooding, power outages and mudslides. Above image is a GOES-MODIS composite taken on January 20. Credit NASA.
Related Links:
Posted in Calif storm satellite image, Calif tornadoes, El Niño, Pacific storm | Tagged: calif flood, calif mudslide, calif rain, calif snow, calif weather | 6 Comments »
Posted by feww on January 21, 2010
A powerful new storm sailed ashore causing more flooding and mudslides
- Four major storms coming from the northern Pacific have struck California, with the 5th expected to hit the region on Thursday.
- Up to a total of 50cm (20 inches) of rain in the worst affected areas
- Snow
- 6.5 m (20-foot) surf
- 100 km/h (60 mph) winds in the coastal areas
- Tornadoes
SECC Near Realtime Composite. Click Image to enlarge. (24-Hr FE ED). Click HERE to Animate Image
The Wednesday storm was expected to dump up to 2 inches (5cm) of rain in the L.A. basin and valley areas and at least 4 inches in foothill and mountain areas, and causing yet more devastating land slides, the National Weather Service said.
Officials are particularly concerned about large areas of hillside in southern California consumed by wildfires in 2009, which could cause massive mudslides as there’s no longer any foliage to prevent the earth from sliding downhill.
Meanwhile, a snow storm forced the California Highway Patrol to close Interstate 5 at the Grapevine, although the Cajon Pass remained open, a report said.
The Los Angeles Police Department has issued more evacuation orders in the northeastern San Fernando Valley, fearing more mudslides in the area.

US Weather Map – Click Image to Enlarge
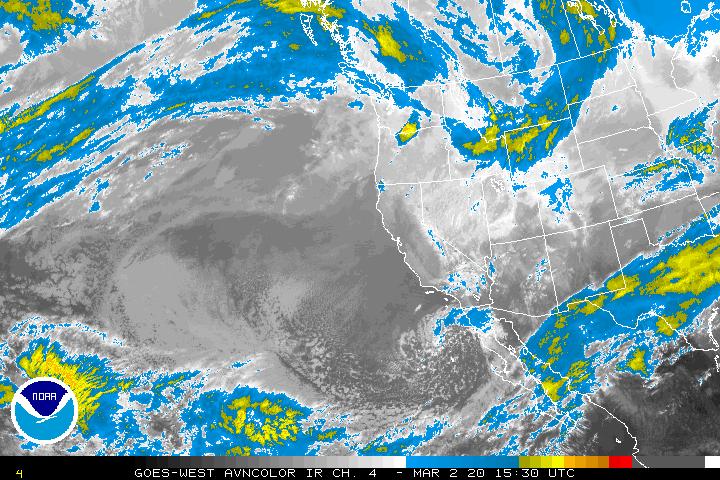
Goes West AVNColor Enhancement Sat Image. Click image to enlarge.
Up to 1,000 homes in the Los Angeles area have already been evacuated in anticipation of mudslides.
“We’re about as ready for the rains that will be coming as we can be,” said LA Mayor Villaraigosa. “If you don’t have to be on the road, why don’t you stay home?”
“We’re asking you to please cooperate,” Mayor Villaraigosa added. “There’s too many people not heeding advice.”
In La Canada Flintridge, a northern suburb of Los Angeles near the base of the San Gabriel Mountains, the residents were told to do exactly the opposite. Residents along canyon roads were ordered to evacuate, and stay away for four days.
“I cannot stress enough that this is not the time to stay,” said Mayor Laura Olhasso. “So if you’ve been asked to leave and you have left, please don’t be fatigued. Please leave again.”
“South of Los Angeles, near Long Beach and Huntington Beach, at least four funnel clouds were reported Tuesday — rare in California, and especially so in winter. Gary Sewall was in Huntington Harbour when he said he saw a catamaran lifted 50 feet in the air. ” ABC News said.
“I saw what looked like a water spout that was circling around,” he said, “and then we saw the boat out across the channel go up in the air and come crashing down.”
Heavy rain, flooding and mudslides have closed roads, inundated homes and cars causing damage. Powerful winds with gusts 130 km/h gusts have damaged power lines leaving more than 750,000 customers without power at times. Up to four tornadoes have touched down in Southern California, this week!

NWS Radar Mosaic. Click Image to enlarge and update. (24-Hr FE ED).

Hazards. Click Image to enlarge and update. (24-Hr FE ED).

Snow Accumulation. Click Image to enlarge and update. (24-Hr FE ED).

Weather Forecast. Click Image to enlarge and update. (24-Hr FE ED).

Predominant Weather. Click Image to enlarge and update. (24-Hr FE ED).

IR Satellite Image. Click Image to enlarge and update. (24-Hr FE ED).

Water Vapor Satellite Image. Click Image to enlarge and update. (24-Hr FE ED).

Max Temps. Click Image to enlarge and update. (24-Hr FE ED).

Min Temps. Click Image to enlarge and update. (24-Hr FE ED).

Temp – Real Time Mesoscale Analysis. Click Image to enlarge and update. (24-Hr FE ED).

6-Hr Precipitation amount. Click Image to enlarge and update. (24-Hr FE ED)

12-Hr Probability Precipitation (%). Click Image to enlarge and update. (24-Hr FE ED).

Wind Speed. Click Image to enlarge and update. (24hr- FE EDT).

Wind Gusts. Click Image to enlarge and update. (24hr- FE ED)

Sky Cover. Click Image to enlarge and update. (24hr- FE ED)

River and Lake Levels. Click Image to Enter Portal.
US Seasonal Drought Outlook. Click Image to enlarge.

Surface Weather Charts. Click image to enter portal.

For hazard warning codes see: NOAA/NWS US Weather Hazard Map

NOAA GOES 11 – Near Real Time Full Disk. Click image to enlarge.
Related Links:
Posted in El Niño, Pacific storm, Radar Mosaic, US Hazards Map, US Weather Map | Tagged: AO, Arctic Oscillation, calif mudslides, Calif Predominant Weather, calif weather, IR Satellite Image, Real Time Mesoscale Analysis, satellite imagery, Snow Accumulation Map, US Temp Map, US Weather Forecast | 7 Comments »
Posted by feww on January 19, 2010
ENSO Cycle: Recent Evolution, Current Status and Predictions
El Niño Weekly UPDATE prepared by Climate Prediction Center / NCEP – 18 January 2010
The latest weekly SST departures are:
- Niño 4 ~ 1.5ºC
- Niño 3.4 ~ 1.7ºC
- Niño 3 ~ 1.1ºC
- Niño 1+2 ~ 0.3ºC
El Niño Map. [SOURCE: NOAA/ Climate Prediction Center / NCEP]
SST Departures (°C) in the Tropical Pacific During the Last 4 Weeks
During the last 4-weeks, equatorial SSTs were more than 2.0°C above average between 170°W and 145°W.
Global SST Departures (°C)
During the last four weeks, equatorial SSTs were above-average across the Pacific and Indian Oceans. Also, above-average SSTs covered large areas of the Northern Hemisphere subtropics.
Weekly SST Departures (°C) for the Last Four Weeks
- During the last four weeks, positive SST anomalies have weakened across the eastern equatorial Pacific Ocean.
- During the last 30 days, equatorial SST anomalies have decreased in parts of the eastern Pacific.
Sub-Surface Temperature Departures (°C) in the Equatorial Pacific
- During late November –December 2009, positive temperature anomalies expanded eastward across the eastern equatorial Pacific, in response to the downwelling phase of an oceanic Kelvin wave.
- In late December 2009, positive anomalies increased in the central equatorial Pacific in association with another Kelvin wave.
- The most recent period (below) indicates a broad area of above-average subsurface temperatures across the equatorial Pacific Ocean.

Click image to enlarge.

Intraseasonal Variability
- Intraseasonal variability in the atmosphere (wind and pressure), which is often related to the Madden-Julian Oscillation (MJO), can significantly impact surface and subsurface conditions across the Pacific Ocean.
- Related to this activity
- Significant weakening of the low-level easterly winds usually initiates an eastward-propagating oceanic Kelvin wave.
- Several Kelvin waves have occurred during the last year (see next slide).


Summary:
- El Niño is present across the equatorial Pacific Ocean.
- Sea surface temperatures (SST) are 1.0ºC-3.0ºC above-average across much of the central and east-central equatorial Pacific.
- Based on current observations and dynamical model forecasts, El Niño is expected to continue at least into the Northern Hemisphere spring 2010.
Unless otherwise stated, information and images on this page are sourced from Climate Prediction Center/NCEP/NOAA. Edited by FEWW
For additional information, previous entries and diagrams see links below:
Related Links:
El Niño Updates:
Posted in Climate Prediction, El Niño, El Niño 2010, El Niño update 2010, ENSO | Tagged: El Niño impact, El Niño weekly report, Madden-Julian Oscillation, Oceanic Niño Index, Pacific SST Outlook, SST anomalies, Tropical Pacific SST | 4 Comments »
Posted by feww on January 12, 2010
ENSO Cycle: Recent Evolution, Current Status and Predictions
El Niño Weekly UPDATE prepared by Climate Prediction Center / NCEP – 11 January 2010
The latest weekly SST departures are:
- Niño 4 ~ 1.5ºC
- Niño 3.4 ~ 1.8ºC
- Niño 3 ~ 1.2ºC
- Niño 1+2 ~ 0.3ºC
El Niño Map. [SOURCE: NOAA/ Climate Prediction Center / NCEP]
SST Departures (°C) in the Tropical Pacific During the Last 4 Weeks

During the last 4-weeks, equatorial SSTs were more than 2.0°C above average in regions east of the Date Line.
Global SST Departures (°C)

During the last four weeks, equatorial SSTs were above-average across the Pacific and Indian Oceans. Also, above-average SSTs covered large areas of the Northern Hemisphere subtropics.
Unless otherwise stated, information and images on this page are sourced from Climate Prediction Center/NCEP/NOAA. Edited by FEWW
Summary
- El Niño is present across the equatorial Pacific Ocean.
- Sea surface temperatures (SST) are 1.0ºC to 3.0ºC above-average across much of the central and east-central equatorial Pacific.
- Based on current observations and dynamical model forecasts, El Niño is expected to continue at least into the Northern Hemisphere spring 2010.
For additional information, previous entries and diagrams see links below:
Related Links:
El Niño Updates:
Posted in Climate Prediction, El Niño, El Niño 2010, El Niño update 2010, ENSO | Tagged: El Niño impact, El Niño weekly report, Oceanic Niño Index, Pacific SST Outlook, SST anomalies, Tropical Pacific SST | 3 Comments »
Posted by feww on January 5, 2010
ENSO Cycle: Recent Evolution, Current Status and Predictions
El Niño Weekly UPDATE prepared by Climate Prediction Center / NCEP – 4 January 2010
The latest weekly SST departures are:
- Niño 4 ~ 1.4ºC
- Niño 3.4 ~ 1.8ºC
- Niño 3 ~ 1.4ºC
- Niño 1+2 ~ 0.7ºC
El Niño Map. [SOURCE: NOAA/ Climate Prediction Center / NCEP]
Summary
- El Niño is present across the equatorial Pacific Ocean.
- Sea surface temperatures (SST) are 1.0ºC-3.0ºC above-average across much of the central and east-central equatorial Pacific.
- Based on current observations and dynamical model forecasts, El Niño is expected to last at least into the Northern Hemisphere spring [and summer] 2010.
Unless otherwise stated, information and images on this page are sourced from Climate Prediction Center/NCEP/NOAA. Edited by FEWW
For additional information, previous entries and diagrams see links below:
Related Links:
El Niño Updates:
Posted in Climate Prediction, El Niño, El Niño 2010, El Niño update 2010, ENSO | Tagged: El Niño impact, El Niño weekly report, Oceanic Niño Index, Pacific SST Outlook, SST anomalies, Tropical Pacific SST | 2 Comments »
Posted by feww on December 29, 2009
ENSO Cycle: Recent Evolution, Current Status and Predictions
El Niño Weekly UPDATE prepared by Climate Prediction Center / NCEP – 28 December 2009
The latest weekly SST departures are:
- Niño 4 ~ 1.5ºC
- Niño 3.4 ~ 1.9ºC
- Niño 3 ~ 1.6ºC
- Niño 1+2 ~ 0.5ºC
El Niño Map. [SOURCE: NOAA/ Climate Prediction Center / NCEP]
SST Departures (°C) in the Tropical Pacific During the Last 4 Weeks
During the last 4-weeks, SSTs were at least 1.0°C above average across much of the equatorial Pacific east of 170ºE, and more than 2.0°C above average across large regions in the eastern half of the Pacific.
Global SST Departures (°C)
During the last four weeks, equatorial SSTs were above-average across the Pacific and Indian Oceans. Also, above-average SSTs covered large areas of the Northern Hemisphere subtropics.
Weekly SST Departures (°C) for the Last Four Weeks
- During the last four weeks, positive SST anomalies have persisted across the equatorial Pacific Ocean.
- During the last 30 days, equatorial SST anomalies have increased across the eastern equatorial Pacific.

Click image to enlarge. Source: Climate Prediction Center / NCEP

Click image to enlarge. Source: Climate Prediction Center / NCEP
Atmospheric Circulation over the North Pacific & North America During the Last 60 Days
During most of November, a nearly zonal pattern of above-average heights over the mid-latitudes was observed with anomalous troughingover the higher latitudes. This pattern led to above-average temperatures across much of North America and below-average temperatures in Alaska. From late November through December, the anomalous zonal pattern of above-average heights at mid-latitudes was replaced by strong anomalous troughs over the N. Pacific and much of N. America and above-average heights at high latitudes. This pattern led to below-average temperatures acrossthe U.S. and Canada and above-average temperatures over Alaska.
Outgoing Longwave Radiation (OLR) Anomalies

Click image to enlarge. Source: Climate Prediction Center / NCEP
Pacific Niño 3.4 SST Outlook
- The models continue to disagree on the eventual strength of El Niño, but nearly all indicate at least a moderate strength El Niño (3-month average greater than +1.0°C) through January-February-March 2010.
- After peaking, the majority of models indicate Niño-3.4 will gradually weaken, but that El Niño will continue into April-May-June 2010.
Summary
- El Niño is present across the equatorial Pacific Ocean.
- Sea surface temperatures (SST) are 1.0ºC to 3.0ºC above-average across much of the central and east-central equatorial Pacific.
- Based on current observations and dynamical model forecasts, El Niño is expected to continue and last at least into the Northern Hemisphere spring 2010
Unless otherwise stated, information and images on this page are sourced from Climate Prediction Center/NCEP/NOAA. Edited by FEWW
Related Links:
El Niño Updates:
Posted in Climate Prediction, El Niño, El Niño 2010, El Niño update December, Tropical Pacific SST | Tagged: El Niño impact, El Niño weekly report, ENSO, Oceanic Niño Index, Pacific SST Outlook, SST anomalies | 1 Comment »
Posted by feww on December 24, 2009
Will 2010 Be Hotter and Drier Still?
Weekly highest maximum temperature for Australia

Source: BOM. Click image to enlarge. Image may be subject to copyright.
Current month to date rainfall totals for Australia

Source: BOM. Click image to enlarge. Image may be subject to copyright.
Australian Region Infrared Satellite Image

Source: Image from Japan Meteorological Agency satellite MTSAT-1R via Bureau of Meteorology. Click image to enlarge and update. Image may be subject to copyright.
FEWW Comments on the ongoing El Niño:
- Pacific Ocean surface temperature anomalies are at their highest in the past 12 years, exceeding the anomalies recorded in the 1997-98 El Niño.
- The precipitation remains high near the equator, and low in places like Australia.
- The ongoing drought and deluge would cause substantial damage to crops and infrastructure.
- Extremes of climate enhanced by El Nino in 2010 could contribute to food shortages in many parts of the world.
Related Links:
El Niño Updates:
- El Niño [Main Page and Links Archive]
Posted in Australia rainfall, climate forecast, Dance of Ocean and Atmosphere, El Niño, Satellite Image Australia | Tagged: Australia climate, Australia temperature, El Niño in Australia, Impact of El Niño, rainfall totals for Australia | 1 Comment »
Posted by feww on December 22, 2009
FEWW Comments on the ongoing El Niño:
- Pacific Ocean surface temperature anomalies are at their highest in the past 12 years, exceeding the anomalies recorded in the 1997-98 El Niño.
- The precipitation remains high near the equator, and low in places like Australia.
- The ongoing drought and deluge would cause substantial damage to crops and infrastructure.
- Extremes of climate enhanced by El Nino in 2010 could contribute to food shortages in many parts of the world.
ENSO Cycle: Recent Evolution, Current Status and Predictions
El Niño Weekly UPDATE prepared by Climate Prediction Center / NCEP – 21 December 2009

Click image to enlarge. Source: Climate Prediction Center / NCEP
The latest weekly SST departures are:
- Niño 4 ~ 1.4ºC
- Niño 3.4 ~ 1.8ºC
- Niño 3 ~ 1.6ºC
- Niño 1+2 ~ -0.2ºC
El Niño Map. [SOURCE: NOAA/ Climate Prediction Center / NCEP]
SST Departures (°C) in the Tropical Pacific During the Last 4 Weeks
During the last 4-weeks, SSTs were at least 1.0°C above average across much of the equatorial Pacific east of 170ºE, and more than 2.0°C above average across portions of the eastern half of the Pacific.

Click image to enlarge. Source: Climate Prediction Center / NCEP
Global SST Departures (°C) During the last four weeks, equatorial SSTs were above-average across the Pacific and Indian Oceans. Also, above-average SSTs covered large areas of the Northern Hemisphere subtropics.

Click image to enlarge. Source: Climate Prediction Center / NCEP
Weekly SST Departures (°C) for the Last Four Weeks
- During the last four weeks, the largest positive SST anomalies have expanded eastward across the equatorial Pacific Ocean.
- During the last 30 days, equatorial SST anomalies have increased across much of the across the eastern equatorial Pacific.
Central & Eastern Pacific Upper-Ocean (0-300 m) Weekly Heat Content Anomalies
Since April 2009, the upper-ocean heat content has been above average across the eastern half of the equatorial Pacific Ocean. The heat content was previously below-average from mid-August 2008 through March 2009, with a minimum reached in late December 2008.

Click image to enlarge. Source: Climate Prediction Center / NCEP

Click image to enlarge. Source: Climate Prediction Center / NCEP

Click image to enlarge. Source: Climate Prediction Center / NCEP

Click image to enlarge. Source: Climate Prediction Center / NCEP

Click image to enlarge. Source: Climate Prediction Center / NCEP
Atmospheric Circulation over the North Pacific & North America During the Last 60 Days

During the first half of November, a nearly zonal pattern of above-average heights over the mid-latitudes was observed with anomalous troughing over the higher latitudes. This pattern led to above-average temperatures across much of North America and below-average temperatures in Alaska. From late November to the first half of December, the anomalous zonal pattern of above-average heights at mid-latitudes was replaced by strong anomalous troughs across the N. Pacific and much of N. America and above-average heights near Alaska. This pattern led to below-average temperatures across the U.S. and Canada and above-average temperatures over Alaska. Click image to enlarge. Source: Climate Prediction Center / NCEP
Pacific Niño 3.4 SST Outlook
- The models continue to disagree on the eventual strength of El Niño, but nearly all indicate at least a moderate strength El Niño (3-month average greater than +1.0°C) through January-February-March 2010.
- After peaking, the majority of models indicate Niño-3.4 will gradually weaken, but that El Niño will continue into April-May-June 2010. [International Research Institute (IRI) for Climate and Society (updated 17 Dec 2009).]
Summary
- El Niño is present across the equatorial Pacific Ocean.
- Sea surface temperatures (SST) are at least 1.0ºC-2.0ºC above-average across much of the central and east-central equatorial Pacific.
- Based on current observations and dynamical model forecasts, El Niño is expected to continue and last at least into the Northern Hemisphere spring 2010.
Information and images on this page are sourced from Climate Prediction Center/NCEP/NOAA. Edited by FEWW
Related Links:
El Niño Updates:
Posted in Climate Prediction, El Niño, El Niño 2010, El Niño update, Tropical Pacific SST | Tagged: El Niño weekly report, ENSO, Oceanic Niño Index, Pacific SST Outlook, SST anomalies | 2 Comments »
Posted by feww on December 8, 2009
ENSO Cycle: Recent Evolution, Current Status and Predictions
The following UPDATE is prepared by Climate Prediction Center / NCEP – 7 December 2009
The latest weekly SST departures are:
- Niño 4 ~ 1.4ºC
- Niño 3.4 ~ 1.7ºC
- Niño 3 ~ 1.4ºC
- Niño 1+2 ~ 0.4ºC
El Niño Map. [SOURCE: NOAA/ Climate Prediction Center / NCEP]
SST Departures (°C) in the Tropical Pacific During the Last 4 Weeks
During the last 4-weeks, SSTs were at least 1.0°C above average across much of the equatorial Pacific and more than 2.0°C above average between 180°and 130°W.
Global SST Departures (°C)
During the last four weeks, equatorial SSTs were above-average across the Pacific and Indian Oceans. Also, above-average SSTs covered large areas of the Northern Hemisphere subtropics.
Weekly SST Departures (°C) for the Last Four Weeks
- During the last four weeks, positive SST anomalies persisted across the central and eastern equatorial Pacific Ocean.
- During the last 30 days, equatorial SST anomalies only changed in small regions across the equatorial Pacific.
Sub-Surface Temperature Departures (°C) in the Equatorial Pacific
- During October –November 2009, positive temperature anomalies at thermocline depth increased and expanded eastward across the eastern equatorial Pacific, in response to the downwelling phase of an oceanic Kelvin wave.
- The most recent period indicates the eastward expansion of positive anomalies has slowed in the eastern Pacific Ocean.
Atmospheric Circulation over the North Pacific & North America During the Last 60 Days
See: El Niño Update [30 Nov 2009]
Weekly Heat Content Evolution in the Equatorial Pacific

(A) The negative anomalies weakened during January-March 2009, with positive anomalies becoming established in late March.
(B) In April 2009, the combined effects of an oceanic Kelvin wave and weaker-than-average easterly trade winds contributed to an increase in the upper-ocean heat content anomalies across the Pacific Ocean.
Since April 2009, heat content anomalies have remained above-average, but there has been considerable month-to-month variability due to Kelvin wave activity.
(C) During November, the downwellingphase of a Kelvin wave contributed to an increase in heat content.
Oceanic Kelvin waves have alternating warm and cold phases. The warmp hase is indicated by dashed lines. Down-welling and warming occur in the leading portion of a Kelvin wave, and up-welling and cooling occur in the trailing portion.
Low-level (850-hPa) Zonal (east-west) Wind Anomalies (m s -1)
From April-October 2009, the MJO was weak to nonexistent. Since May 2009, westerly wind anomalies have covered large portions of the equatorial Pacific, except near the Date Line.During November 2009, the MJO became active, which contributed to anomalous easterlies shifting eastward from the Indian Ocean to the central and eastern Pacific. Recently, westerly anomalies have returned across much of the equatorial Pacific Ocean.
Summary
- El Niño is present across the equatorial Pacific Ocean.
- Sea surface temperatures (SST) are at least 1.0ºC-2.0ºC above-average across much of the central and east-central equatorial Pacific.
- Based on current observations and dynamical model forecasts, El Niño is expected to last through at least the Northern Hemisphere winter2009-10.
Information and images on this page are sourced from Climate Prediction Center/NCEP/NOAA. Edited by FEWW
Related Links:
El Niño Updates:
Posted in Climate Prediction, El Niño, ENSO, Global SST anomalies, Pacific SST Outlook | Tagged: El Niño update, El Niño weekly report, Oceanic Niño Index, Papua New Guinea, Tropical Pacific SST | 2 Comments »
Posted by feww on December 1, 2009
ENSO Cycle: Recent Evolution, Current Status and Predictions
The following UPDATE is prepared by
Climate Prediction Center / NCEP – 30 November 2009
The latest weekly SST departures are:
- Niño 4 ~ 1.6ºC
- Niño 3.4 ~ 1.7ºC
- Niño 3 ~ 1.3ºC
- Niño 1+2 ~ 0.2ºC
El Niño Map. [SOURCE: NOAA/ Climate Prediction Center / NCEP]
SST Departures (°C) in the Tropical Pacific During the Last 4 Weeks
During the last 4-weeks, SSTs were at least 1.0°C above average across much of the equatorial Pacific and more than 2.0°C above average between 180°and 130°W.

[SOURCE: NOAA/ Climate Prediction Center / NCEP]
Global SST Departures (°C)
During the last four weeks, equatorial SSTs were above-average across the Pacific and Indian Oceans. Also, above-average SSTs covered large areas of the Northern Hemisphere subtropics.

[SOURCE: NOAA/ Climate Prediction Center / NCEP]
Weekly SST Departures (°C) for the Last Four Weeks
- During the last four weeks, positive SST anomalies persisted across the central and eastern equatorial Pacific Ocean.
- During the last 30 days, equatorial SST anomalies increased in some parts across the eastern Pacific.
 |
|

Tropical OLR and Wind Anomalies During the Last 30 Days

TOP: Positive OLR anomalies (suppressed convection and precipitation, red shading) were present over Indonesia, Malaysia, Papua New Guinea, and Australia. Negative OLR anomalies (enhanced convection and precipitation, blue shading) were located over the western tropical Pacific Ocean just southeast of Papua New Guinea.
Middle: Low-level (850-hPa) westerly anomalies remained over the east-central equatorial Pacific.
Above: Upper-level (200-hPa) easterly anomalies were observed across the eastern equatorial Pacific. An anticycloniccouplet was evident in the subtropics of both hemispheres, which is consistent with El Niño.
Atmospheric Circulation over the North Pacific & North America During the Last 60 Days
During October, a nearly zonal pattern of below-average heights over the mid-latitudes was observed with an anomalous ridge over Alaska and the higher latitudes. This pattern contributed to below-average temperatures across Canada and much of the U.S. During November, the anomalous zonal pattern of below-average heights at mid-latitudes had been replaced by strong anomalous ridges across the N. Pacific and much of N. America with below-average heights across Alaska. This pattern has led to above-average temperatures across much of Canada and the United Statesand below-average temperatures in Alaska.
Intraseasonal Variability
- Intraseasonal variability in the atmosphere (wind and pressure), which is often related to the Madden-Julian Oscillation (MJO), can significantly impact surface and subsurface conditions across the Pacific Ocean.
- Related to this activity
- Significant weakening of the low-level easterly winds usually initiates an eastward-propagating oceanic Kelvin wave.
- Several Kelvin waves have occurred during the last year (see next slide).
Summary
- El Niño is present across the equatorial Pacific Ocean.
- Sea surface temperatures (SST) are at least 1.0ºC-2.0ºC above-average across much of the central and east-central equatorial Pacific.
- Based on current observations and dynamical model forecasts, El Niño is expected to last through at least the Northern Hemisphere winter2009-10.
Information and images on this page are sourced from Climate Prediction Center/NCEP/NOAA. Edited by FEWW
Related Links:
El Niño Updates:
Posted in Climate Prediction, El Niño, ENSO, Pacific SST Outlook, Uncategorized | Tagged: australia, El Niño update, El Niño weekly report, Global SST anomalies, Indonesia, Malaysia, Oceanic Niño Index, Papua New Guinea, Tropical Pacific SST | 2 Comments »
Posted by feww on November 30, 2009
Philippines:
November 28, 2009 – Tropical depression Urduja
Four people were killed and 13 others injured when tropical depression “Urduja” pummeled several provinces in Mindanao, Philippines according to disaster officials.
Three of the fatalities occurred as a result of landslides triggered by heavy rain and flooding.
“A total of 82,324 families or 404,623 persons were affected in 93 barangays, four cities and 23 municipalities in the provinces of Camiguin, Lanao del Norte and Misamis Oriental in Northern Mindanao and Agusan del Norte and Dinagat Island in Caraga Region,” the NDCC reported.
“At the height of Tropical Depression ‘Urduja,’ 3,293 persons, 110 vehicles and 99 vessels were stranded in various ports in Southern Tagalog, Bicol Region, Eastern Visayas and Northern Mindanao.”
Northeast Monsoons
In the first week of November, Northeast Monsoons and strong winds affected up to 120,000 people in 165 districts throughout Mindanao, northern and eastern Luzon and other regions in the Philippines.
Argentina, Uruguay:
Severe flooding caused by the “heaviest rains in 50 years” have killed at least 10 people and forced 15,000 people to evacuate in northern parts of Argentina and Uruguay. The fatalities were caused by drowning and mudslides.
The recent heavy rain in the regions follows months of drought in NE Argentina. Extensive deforestation in the country’s northern regions has impacted the regional climate resulting in extreme of droughts and deluge.
The land use change, transforming forests to agricultural land for growing soybeans, has negatively affected the soil’s water-carrying capacity, environmentalists say.
The local weather service has warned that a severe storm front could bring additional heavy rainfall, wind gusts and hail this week.
Related Links:
Posted in argentina, Climate Change, deforestation, El Niño, storms | Tagged: Climate-Related Disasters, flood, Landslide, mudslide, Philippines, Urduja, Uruguay | Leave a Comment »
Posted by feww on November 24, 2009
ENSO Cycle: Recent Evolution, Current Status and Predictions
The following UPDATE is prepared by
Climate Prediction Center / NCEP – 23 November 2009
The latest weekly SST departures are:
- Niño 4 ~ 1.5ºC
- Niño 3.4 ~ 1.7ºC
- Niño 3 ~ 1.2ºC
- Niño 1+2 ~ 0.5ºC
El Niño Map. [SOURCE: NOAA/ Climate Prediction Center / NCEP]
SST Departures (°C) in the Tropical Pacific During the Last 4 Weeks
During the last 4-weeks, SSTs were at least 1.0°C above average across much of the equatorial Pacific and more than 2.0°C above average between 180°and 140°W. [Expanding across the Tropical Pacific. FEWW ]

[SOURCE: NOAA/ Climate Prediction Center / NCEP]
Global SST Departures (°C)
During the last four weeks, equatorial SSTs were above-average across the Pacific and Indian Oceans. Also, above-average SSTs covered large areas of the Northern Hemisphere subtropics.

[SOURCE: NOAA/ Climate Prediction Center / NCEP]
Weekly SST Departures (°C) for the Last Four Weeks
- During the last four weeks, positive equatorial SST anomalies persisted across the central and eastern Pacific Ocean.
- During the last 30 days, equatorial SST anomalies increased in some regions across the eastern half of the Pacific.
Upper-Ocean Conditions in the Eq. Pacific
- The basin-wide equatorial upper ocean (0-300 m) heat content is greatestprior to and during the early stages of a Pacific warm (El Niño) episode (compare top 2 panels) and leastprior to and during the early stages of a cold(La Niña) episode.
- The slope of the oceanic thermocline is least (greatest) during warm (cold) episodes.
- Recent values of the upper-ocean heat anomalies (positive) and the thermocline slope index (negative) reflect El Niño.
Sub-Surface Temperature Departures (°C) in the Equatorial Pacific
- During late September –mid November 2009, temperature anomalies at thermocline depth increased and expanded eastward across the central and east-central equatorial Pacific, in response to the downwelling phase of an oceanic Kelvin wave.
- The most recent period shows a continued eastward expansion of positive anomalies in the equatorial Pacific near 50 -150m depth.
Tropical OLR and Wind Anomalies During the Last 30 Days

Atmospheric Circulation over the North Pacific & North America During the Last 60 Day

Click image to enlarge.
Intraseasonal Variability
- Intraseasonal variability in the atmosphere (wind and pressure), which is often related to the Madden-Julian Oscillation (MJO), can significantly impact surface and subsurface conditions across the Pacific Ocean.
- Related to this activity
- significant weakening of the low-level easterly winds usually initiates an eastward-propagating oceanic Kelvin wave.
- Several Kelvin waves have occurred during the last year (see next slide).


Summary
- El Niño is present across the equatorial Pacific Ocean.
- Sea surface temperatures (SST) are at least 1.0ºC-2.0ºC above-average across much of the central and east-central equatorial Pacific.
- Based on current observations and dynamical model forecasts, El Niño is expected to continue to strengthen and last through at least the Northern Hemisphere winter 2009-10.
Information and images on this page are sourced from Climate Prediction Center/NCEP/NOAA. Edited by FEWW
Related Links:
El Niño Updates:
Posted in Climate Prediction, El Niño, El Niño latest news, El Niño update, El Niño weekly report, ENSO | Tagged: australia, eastern Pacific, equatorial Pacific Ocean, equatorial SSTs, Global SST anomalies, Indian Ocean SST, Indonesia, Negative OLR anomalies, North Pacific Ocean, Ocean SST, Oceanic Kelvin waves, Pacific Ocean, Papua New Guinea, positive OLR, Positive SST, suppressed convection and precipitation, Tropical Pacific SST, western tropical pacific ocean, wind anomaly | Leave a Comment »


